Citibank 2013 Annual Report Download - page 278
Download and view the complete annual report
Please find page 278 of the 2013 Citibank annual report below. You can navigate through the pages in the report by either clicking on the pages listed below, or by using the keyword search tool below to find specific information within the annual report.-
 1
1 -
2
-
3
-
4
-
5
-
6
-
7
-
8
-
9
-
10
-
11
-
12
-
13
-
14
-
15
-
16
-
17
-
18
-
19
-
20
-
21
-
22
-
23
-
24
-
25
-
26
-
27
-
28
-
29
-
30
-
31
-
32
-
33
-
34
-
35
-
36
-
37
-
38
-
39
-
40
-
41
-
42
-
43
-
44
-
45
-
46
-
47
-
48
-
49
-
50
-
51
-
52
-
53
-
54
-
55
-
56
-
57
-
58
-
59
-
60
-
61
-
62
-
63
-
64
-
65
-
66
-
67
-
68
-
69
-
70
-
71
-
72
-
73
-
74
-
75
-
76
-
77
-
78
-
79
-
80
-
81
-
82
-
83
-
84
-
85
-
86
-
87
-
88
-
89
-
90
-
91
-
92
-
93
-
94
-
95
-
96
-
97
-
98
-
99
-
100
-
101
-
102
-
103
-
104
-
105
-
106
-
107
-
108
-
109
-
110
-
111
-
112
-
113
-
114
-
115
-
116
-
117
-
118
-
119
-
120
-
121
-
122
-
123
-
124
-
125
-
126
-
127
-
128
-
129
-
130
-
131
-
132
-
133
-
134
-
135
-
136
-
137
-
138
-
139
-
140
-
141
-
142
-
143
-
144
-
145
-
146
-
147
-
148
-
149
-
150
-
151
-
152
-
153
-
154
-
155
-
156
-
157
-
158
-
159
-
160
-
161
-
162
-
163
-
164
-
165
-
166
-
167
-
168
-
169
-
170
-
171
-
172
-
173
-
174
-
175
-
176
-
177
-
178
-
179
-
180
-
181
-
182
-
183
-
184
-
185
-
186
-
187
-
188
-
189
-
190
-
191
-
192
-
193
-
194
-
195
-
196
-
197
-
198
-
199
-
200
-
201
-
202
-
203
-
204
-
205
-
206
-
207
-
208
-
209
-
210
-
211
-
212
-
213
-
214
-
215
-
216
-
217
-
218
-
219
-
220
-
221
-
222
-
223
-
224
-
225
-
226
-
227
-
228
-
229
-
230
-
231
-
232
-
233
-
234
-
235
-
236
-
237
-
238
-
239
-
240
-
241
-
242
-
243
-
244
-
245
-
246
-
247
-
248
-
249
-
250
-
251
-
252
-
253
-
254
-
255
-
256
-
257
-
258
-
259
-
260
-
261
-
262
-
263
-
264
-
265
-
266
-
267
-
 268
268 -
 269
269 -
 270
270 -
 271
271 -
 272
272 -
 273
273 -
 274
274 -
 275
275 -
 276
276 -
 277
277 -
 278
278 -
 279
279 -
 280
280 -
 281
281 -
 282
282 -
 283
283 -
 284
284 -
 285
285 -
 286
286 -
 287
287 -
 288
288 -
289
-
290
-
291
-
292
-
293
-
294
-
295
-
296
-
297
-
298
-
299
-
300
-
301
-
302
-
303
-
304
-
305
-
306
-
307
-
308
-
309
-
310
-
311
-
312
-
313
-
314
-
315
-
316
-
317
-
318
-
319
-
320
-
321
-
322
-
323
-
324
-
325
-
326
-
327
-
328
-
329
-
330
-
331
-
332
-
333
-
334
-
335
-
336
-
337
-
338
-
339
-
340
-
341
-
342
 |
 |
260
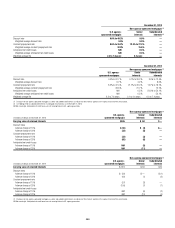
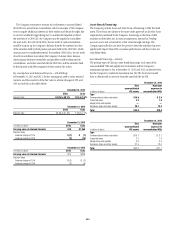
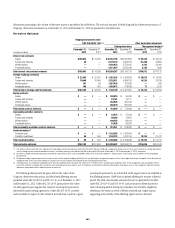
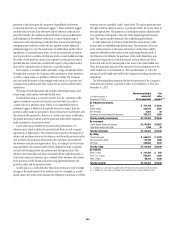
Information pertaining to the volume of derivative activity is provided in the table below. The notional amounts, for both long and short derivative positions, of
Citigroup’s derivative instruments as of December 31, 2013 and December 31, 2012 are presented in the table below.
Derivative Notionals
Hedging instruments under
ASC 815 (SFAS 133) (1)(2) Other derivative instruments
Trading derivatives Management hedges (3)
In millions of dollars
December 31,
2013
December 31,
2012
December 31,
2013
December 31,
2012
December 31,
2013
December 31,
2012
Interest rate contracts
Swaps $150,823 $114,296 $36,352,196 $30,050,856 $ 93,286 $ 99,434
Futures and forwards 20 —6,129,742 4,823,370 61,398 45,856
Written options ——4,105,632 3,752,905 3,103 22,992
Purchased options ——3,971,697 3,542,048 3,185 7,890
Total interest rate contract notionals $150,843 $114,296 $50,559,267 $42,169,179 $160,972 $176,172
Foreign exchange contracts
Swaps $ 22,402 $ 22,207 $ 1,552,292 $ 1,393,368 $ 20,013 $ 16,900
Futures and forwards 79,646 70,484 3,728,511 3,484,193 14,226 33,768
Written options 101 96 1,037,433 781,698 —989
Purchased options 106 456 1,029,872 778,438 71 2,106
Total foreign exchange contract notionals $102,255 $ 93,243 $ 7,348,108 $ 6,437,697 $ 34,310 $ 53,763
Equity contracts
Swaps $ — $ — $ 100,019 $ 96,039 $ — $ —
Futures and forwards ——23,161 16,171 ——
Written options ——333,945 320,243 ——
Purchased options ——266,570 281,236 ——
Total equity contract notionals $ — $ — $ 723,695 $ 713,689 $ — $ —
Commodity and other contracts
Swaps $ — $ — $ 22,978 $ 27,323 $ — $ —
Futures and forwards ——98,265 75,897 ——
Written options ——100,482 86,418 ——
Purchased options ——97,626 89,284 ——
Total commodity and other contract notionals $ — $ — $ 319,351 $ 278,922 $ — $ —
Credit derivatives (4)
Protection sold $ — $ — $ 1,143,363 $ 1,346,494 $ — $ —
Protection purchased 95 354 1,195,223 1,412,194 19,744 21,741
Total credit derivatives $ 95 $ 354 $ 2,338,586 $ 2,758,688 $ 19,744 $ 21,741
Total derivative notionals $253,193 $207,893 $61,289,007 $52,358,175 $215,026 $251,676
(1) The notional amounts presented in this table do not include hedge accounting relationships under ASC 815 (SFAS 133) where Citigroup is hedging the foreign currency risk of a net investment in a foreign operation by
issuing a foreign-currency-denominated debt instrument. The notional amount of such debt was $6,450 million and $4,888 million at December 31, 2013 and December 31, 2012, respectively.
(2) Derivatives in hedge accounting relationships accounted for under ASC 815 (SFAS 133) are recorded in either Other assets/Other liabilities or Trading account assets/Trading account liabilities on the Consolidated
Balance Sheet.
(3) Management hedges represent derivative instruments used in certain economic hedging relationships that are identified for management purposes, but for which hedge accounting is not applied. These derivatives are
recorded in either Other assets/Other liabilities or Trading account assets/Trading account liabilities on the Consolidated Balance Sheet.
(4) Credit derivatives are arrangements designed to allow one party (protection buyer) to transfer the credit risk of a “reference asset” to another party (protection seller). These arrangements allow a protection seller to
assume the credit risk associated with the reference asset without directly purchasing that asset. The Company has entered into credit derivative positions for purposes such as risk management, yield enhancement,
reduction of credit concentrations and diversification of overall risk.
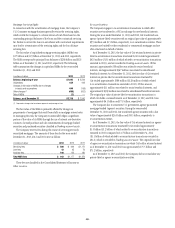
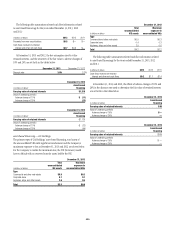
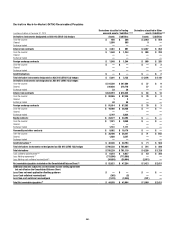
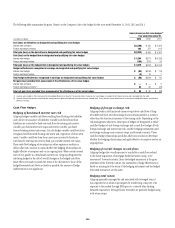
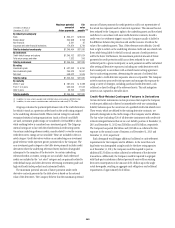
The following tables present the gross and net fair values of the
Company’s derivative transactions, and the related offsetting amount
permitted under ASC 210-20-45 and 815-10-45, as of December 31, 2013
and December 31, 2012. Under ASC 210-20-45, gross positive fair values
are offset against gross negative fair values by counterparty pursuant to
enforceable master netting agreements. Under ASC 815-10-45, payables
and receivables in respect of cash collateral received from or paid to a given
counterparty pursuant to an enforceable credit support annex are included in
the offsetting amount. GAAP does not permit offsetting for security collateral
posted. The table also includes amounts that are not permitted to be offset
under ASC 210-20-45 and 815-10-45, such as security collateral posted or
cash collateral posted at third-party custodians, but would be eligible for
offsetting to the extent an event of default occurred and a legal opinion
supporting enforceability of the offsetting rights has been obtained.