Citibank 2013 Annual Report Download - page 133
Download and view the complete annual report
Please find page 133 of the 2013 Citibank annual report below. You can navigate through the pages in the report by either clicking on the pages listed below, or by using the keyword search tool below to find specific information within the annual report.-
 1
1 -
2
-
3
-
4
-
5
-
6
-
7
-
8
-
9
-
10
-
11
-
12
-
13
-
14
-
15
-
16
-
17
-
18
-
19
-
20
-
21
-
22
-
23
-
24
-
25
-
26
-
27
-
28
-
29
-
30
-
31
-
32
-
33
-
34
-
35
-
36
-
37
-
38
-
39
-
40
-
41
-
42
-
43
-
44
-
45
-
46
-
47
-
48
-
49
-
50
-
51
-
52
-
53
-
54
-
55
-
56
-
57
-
58
-
59
-
60
-
61
-
62
-
63
-
64
-
65
-
66
-
67
-
68
-
69
-
70
-
71
-
72
-
73
-
74
-
75
-
76
-
77
-
78
-
79
-
80
-
81
-
82
-
83
-
84
-
85
-
86
-
87
-
88
-
89
-
90
-
91
-
92
-
93
-
94
-
95
-
96
-
97
-
98
-
99
-
100
-
101
-
102
-
103
-
104
-
105
-
106
-
107
-
108
-
109
-
110
-
111
-
112
-
113
-
114
-
115
-
116
-
117
-
118
-
119
-
120
-
121
-
122
-
 123
123 -
 124
124 -
 125
125 -
 126
126 -
 127
127 -
 128
128 -
 129
129 -
 130
130 -
 131
131 -
 132
132 -
 133
133 -
 134
134 -
 135
135 -
 136
136 -
 137
137 -
 138
138 -
 139
139 -
 140
140 -
 141
141 -
 142
142 -
 143
143 -
144
-
145
-
146
-
147
-
148
-
149
-
150
-
151
-
152
-
153
-
154
-
155
-
156
-
157
-
158
-
159
-
160
-
161
-
162
-
163
-
164
-
165
-
166
-
167
-
168
-
169
-
170
-
171
-
172
-
173
-
174
-
175
-
176
-
177
-
178
-
179
-
180
-
181
-
182
-
183
-
184
-
185
-
186
-
187
-
188
-
189
-
190
-
191
-
192
-
193
-
194
-
195
-
196
-
197
-
198
-
199
-
200
-
201
-
202
-
203
-
204
-
205
-
206
-
207
-
208
-
209
-
210
-
211
-
212
-
213
-
214
-
215
-
216
-
217
-
218
-
219
-
220
-
221
-
222
-
223
-
224
-
225
-
226
-
227
-
228
-
229
-
230
-
231
-
232
-
233
-
234
-
235
-
236
-
237
-
238
-
239
-
240
-
241
-
242
-
243
-
244
-
245
-
246
-
247
-
248
-
249
-
250
-
251
-
252
-
253
-
254
-
255
-
256
-
257
-
258
-
259
-
260
-
261
-
262
-
263
-
264
-
265
-
266
-
267
-
268
-
269
-
270
-
271
-
272
-
273
-
274
-
275
-
276
-
277
-
278
-
279
-
280
-
281
-
282
-
283
-
284
-
285
-
286
-
287
-
288
-
289
-
290
-
291
-
292
-
293
-
294
-
295
-
296
-
297
-
298
-
299
-
300
-
301
-
302
-
303
-
304
-
305
-
306
-
307
-
308
-
309
-
310
-
311
-
312
-
313
-
314
-
315
-
316
-
317
-
318
-
319
-
320
-
321
-
322
-
323
-
324
-
325
-
326
-
327
-
328
-
329
-
330
-
331
-
332
-
333
-
334
-
335
-
336
-
337
-
338
-
339
-
340
-
341
-
342
 |
 |
115
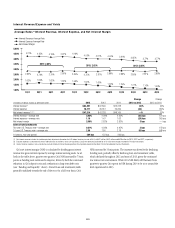
Price Risk—Trading Portfolios
Price risk in Citi’s trading portfolios is monitored using a series of measures,
including but not limited to:
• Value at risk (VAR)
• Stresstesting
• Factor sensitivity
Each trading portfolio across Citi’s business segments (Citicorp, Citi
Holdings and Corporate/Other) has its own market risk limit framework
encompassing these measures and other controls, including trading
mandates, permitted product lists and a new product approval process for
complex products. All trading positions are marked to market, with the
results reflected in earnings.
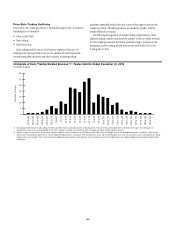
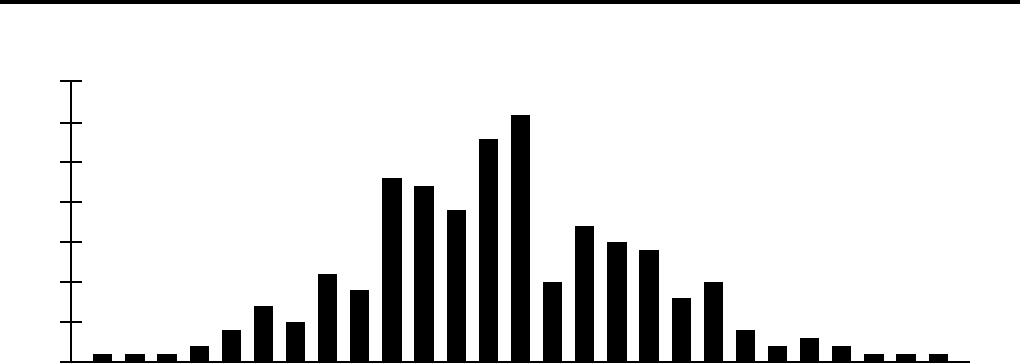
The following histogram of total daily trading-related revenue (loss)
captures trading volatility and shows the number of days in which revenues
for Citi’s trading businesses fell within particular ranges. As shown in the
histogram, positive trading-related revenue was achieved for 92% of the
trading days in 2013.
0
5
10
15
20
25
30
35
(50) to (40)
(70) to (60)
(60) to (50)
40 to 50
30 to 40
20 to 30
10 to 20
(40) to (30)
60 to 70
70 to 80
80 to 90
100 to 110
110 to 120
120 to 130
130 to 140
140 to 150
150 to 160
160 to 170
190 to 200
Number of Days
0 to 10
50 to 60
90 to 100
170 to 180
180 to 190
(30) to (20)
(20) to (10)
(10) to 0
Histogram of Daily Trading-Related Revenue(1)(2)—Twelve Months Ended December 31, 2013
In millions of dollars
(1) Daily trading-related revenue includes trading, net interest and other revenue associated with Citi’s trading businesses. It excludes DVA and CVA adjustments incurred due to changes in the credit quality of
counterparties as well as any associated hedges to that CVA. In addition, it excludes fees and other revenue associated with capital markets origination activities.
(2) Reflects the effects of asymmetrical accounting for economic hedges of certain available-for-sale (AFS) debt securities. Specifically, the change in the fair value of hedging derivatives is included in Trading related
revenue, while the offsetting change in the fair value of hedged AFS debt securities is included in Other comprehensive income and not reflected above. As a result, the asymmetry has an increasing effect on Trading
related revenue as the change in the fair value of economic hedging derivatives becomes more significant, and is the primary cause for the majority of days with negative trading revenue and two of highest trading
revenue days.