Citibank 2013 Annual Report Download - page 199
Download and view the complete annual report
Please find page 199 of the 2013 Citibank annual report below. You can navigate through the pages in the report by either clicking on the pages listed below, or by using the keyword search tool below to find specific information within the annual report.-
 1
1 -
2
-
3
-
4
-
5
-
6
-
7
-
8
-
9
-
10
-
11
-
12
-
13
-
14
-
15
-
16
-
17
-
18
-
19
-
20
-
21
-
22
-
23
-
24
-
25
-
26
-
27
-
28
-
29
-
30
-
31
-
32
-
33
-
34
-
35
-
36
-
37
-
38
-
39
-
40
-
41
-
42
-
43
-
44
-
45
-
46
-
47
-
48
-
49
-
50
-
51
-
52
-
53
-
54
-
55
-
56
-
57
-
58
-
59
-
60
-
61
-
62
-
63
-
64
-
65
-
66
-
67
-
68
-
69
-
70
-
71
-
72
-
73
-
74
-
75
-
76
-
77
-
78
-
79
-
80
-
81
-
82
-
83
-
84
-
85
-
86
-
87
-
88
-
89
-
90
-
91
-
92
-
93
-
94
-
95
-
96
-
97
-
98
-
99
-
100
-
101
-
102
-
103
-
104
-
105
-
106
-
107
-
108
-
109
-
110
-
111
-
112
-
113
-
114
-
115
-
116
-
117
-
118
-
119
-
120
-
121
-
122
-
123
-
124
-
125
-
126
-
127
-
128
-
129
-
130
-
131
-
132
-
133
-
134
-
135
-
136
-
137
-
138
-
139
-
140
-
141
-
142
-
143
-
144
-
145
-
146
-
147
-
148
-
149
-
150
-
151
-
152
-
153
-
154
-
155
-
156
-
157
-
158
-
159
-
160
-
161
-
162
-
163
-
164
-
165
-
166
-
167
-
168
-
169
-
170
-
171
-
172
-
173
-
174
-
175
-
176
-
177
-
178
-
179
-
180
-
181
-
182
-
183
-
184
-
185
-
186
-
187
-
188
-
 189
189 -
 190
190 -
 191
191 -
 192
192 -
 193
193 -
 194
194 -
 195
195 -
 196
196 -
 197
197 -
 198
198 -
 199
199 -
 200
200 -
 201
201 -
 202
202 -
 203
203 -
 204
204 -
 205
205 -
 206
206 -
 207
207 -
 208
208 -
 209
209 -
210
-
211
-
212
-
213
-
214
-
215
-
216
-
217
-
218
-
219
-
220
-
221
-
222
-
223
-
224
-
225
-
226
-
227
-
228
-
229
-
230
-
231
-
232
-
233
-
234
-
235
-
236
-
237
-
238
-
239
-
240
-
241
-
242
-
243
-
244
-
245
-
246
-
247
-
248
-
249
-
250
-
251
-
252
-
253
-
254
-
255
-
256
-
257
-
258
-
259
-
260
-
261
-
262
-
263
-
264
-
265
-
266
-
267
-
268
-
269
-
270
-
271
-
272
-
273
-
274
-
275
-
276
-
277
-
278
-
279
-
280
-
281
-
282
-
283
-
284
-
285
-
286
-
287
-
288
-
289
-
290
-
291
-
292
-
293
-
294
-
295
-
296
-
297
-
298
-
299
-
300
-
301
-
302
-
303
-
304
-
305
-
306
-
307
-
308
-
309
-
310
-
311
-
312
-
313
-
314
-
315
-
316
-
317
-
318
-
319
-
320
-
321
-
322
-
323
-
324
-
325
-
326
-
327
-
328
-
329
-
330
-
331
-
332
-
333
-
334
-
335
-
336
-
337
-
338
-
339
-
340
-
341
-
342
 |
 |

181
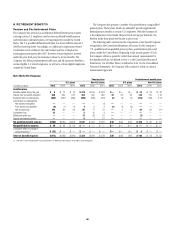
8. RETIREMENT BENEFITS
Pension and Postretirement Plans
The Company has several non-contributory defined benefit pension plans
covering certain U.S. employees and has various defined benefit pension
and termination indemnity plans covering employees outside the United
States. The U.S. qualified defined benefit plan was frozen effective January 1,
2008 for most employees. Accordingly, no additional compensation-based
contributions were credited to the cash balance portion of the plan for
existing plan participants after 2007. However, certain employees covered
under the prior final pay plan formula continue to accrue benefits. The
Company also offers postretirement health care and life insurance benefits to
certain eligible U.S. retired employees, as well as to certain eligible employees
outside the United States.
The Company also sponsors a number of noncontributory, nonqualified
pension plans. These plans, which are unfunded, provide supplemental
defined pension benefits to certain U.S. employees. With the exception of
a few employees covered under the prior final average pay formulas, the
benefits under these plans were frozen in prior years.
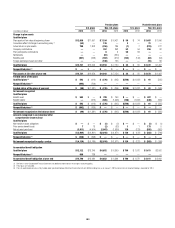
The following table summarizes the components of net (benefit) expense
recognized in the Consolidated Statement of Income for the Company’s
U.S. qualified and nonqualified pension plans, postretirement plans and
plans outside the United States. Beginning in the second quarter of 2013,
the Company utilizes a quarterly, rather than annual, measurement for
the Significant Plans (as defined in Note 1 to the Consolidated Financial
Statements). For All Other Plans (as defined in Note 1 to the Consolidated
Financial Statements), the Company will continue to utilize an annual
measurement approach.
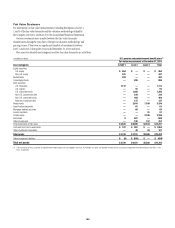
Net (Benefit) Expense
Pension plans Postretirement benefit plans
U.S. plans Non-U.S. plans U.S. plans Non-U.S. plans
In millions of dollars 2013 2012 2011 2013 2012 2011 2013 2012 2011 2013 2012 2011
Qualified plans
Benefits earned during the year $ 8 $ 12 $ 13 $ 210 $ 199 $ 203 $— $— $— $ 43 $ 29 $ 28
Interest cost on benefit obligation 538 565 612 384 367 382 33 44 53 146 116 118
Expected return on plan assets (863) (897) (890) (396) (399) (422) (2) (4) (6) (133) (108) (117)
Amortization of unrecognized
Net transition obligation —— — —— (1) —— — —— —
Prior service cost (benefit) (4) (1) (1) 44 4 (1) (1) (3) —— —
Net actuarial loss 104 96 64 95 77 72 —4 3 45 25 24
Curtailment loss 21 — — 410 4 —— — —— —
Settlement (gain) loss —— — 13 35 10 —— — (1) — —
Special termination benefits —— — 81 27 —— — —— —
Net qualified (benefit) expense $(196) $(225) $(202) $ 322 $ 294 $ 279 $30 $43 $47 $ 100 $ 62 $ 53
Nonqualified plans expense $ 46 $ 42 $ 42 $ — $ — $ — $— $— $— $ — $ — $ —
Cumulative effect of change in
accounting policy (1) $ (23) $ — $ — $ — $ — $ — $— $— $— $ 3 $ — $ —
Total net (benefit) expense $(173) $(183) $(160) $ 322 $ 294 $ 279 $30 $43 $47 $ 103 $ 62 $ 53
(1) See Note 1 to the Consolidated Financial Statements for additional information on the change in accounting policy.