Citibank 2013 Annual Report Download - page 196
Download and view the complete annual report
Please find page 196 of the 2013 Citibank annual report below. You can navigate through the pages in the report by either clicking on the pages listed below, or by using the keyword search tool below to find specific information within the annual report.-
 1
1 -
2
-
3
-
4
-
5
-
6
-
7
-
8
-
9
-
10
-
11
-
12
-
13
-
14
-
15
-
16
-
17
-
18
-
19
-
20
-
21
-
22
-
23
-
24
-
25
-
26
-
27
-
28
-
29
-
30
-
31
-
32
-
33
-
34
-
35
-
36
-
37
-
38
-
39
-
40
-
41
-
42
-
43
-
44
-
45
-
46
-
47
-
48
-
49
-
50
-
51
-
52
-
53
-
54
-
55
-
56
-
57
-
58
-
59
-
60
-
61
-
62
-
63
-
64
-
65
-
66
-
67
-
68
-
69
-
70
-
71
-
72
-
73
-
74
-
75
-
76
-
77
-
78
-
79
-
80
-
81
-
82
-
83
-
84
-
85
-
86
-
87
-
88
-
89
-
90
-
91
-
92
-
93
-
94
-
95
-
96
-
97
-
98
-
99
-
100
-
101
-
102
-
103
-
104
-
105
-
106
-
107
-
108
-
109
-
110
-
111
-
112
-
113
-
114
-
115
-
116
-
117
-
118
-
119
-
120
-
121
-
122
-
123
-
124
-
125
-
126
-
127
-
128
-
129
-
130
-
131
-
132
-
133
-
134
-
135
-
136
-
137
-
138
-
139
-
140
-
141
-
142
-
143
-
144
-
145
-
146
-
147
-
148
-
149
-
150
-
151
-
152
-
153
-
154
-
155
-
156
-
157
-
158
-
159
-
160
-
161
-
162
-
163
-
164
-
165
-
166
-
167
-
168
-
169
-
170
-
171
-
172
-
173
-
174
-
175
-
176
-
177
-
178
-
179
-
180
-
181
-
182
-
183
-
184
-
185
-
 186
186 -
 187
187 -
 188
188 -
 189
189 -
 190
190 -
 191
191 -
 192
192 -
 193
193 -
 194
194 -
 195
195 -
 196
196 -
 197
197 -
 198
198 -
 199
199 -
 200
200 -
 201
201 -
 202
202 -
 203
203 -
 204
204 -
 205
205 -
 206
206 -
207
-
208
-
209
-
210
-
211
-
212
-
213
-
214
-
215
-
216
-
217
-
218
-
219
-
220
-
221
-
222
-
223
-
224
-
225
-
226
-
227
-
228
-
229
-
230
-
231
-
232
-
233
-
234
-
235
-
236
-
237
-
238
-
239
-
240
-
241
-
242
-
243
-
244
-
245
-
246
-
247
-
248
-
249
-
250
-
251
-
252
-
253
-
254
-
255
-
256
-
257
-
258
-
259
-
260
-
261
-
262
-
263
-
264
-
265
-
266
-
267
-
268
-
269
-
270
-
271
-
272
-
273
-
274
-
275
-
276
-
277
-
278
-
279
-
280
-
281
-
282
-
283
-
284
-
285
-
286
-
287
-
288
-
289
-
290
-
291
-
292
-
293
-
294
-
295
-
296
-
297
-
298
-
299
-
300
-
301
-
302
-
303
-
304
-
305
-
306
-
307
-
308
-
309
-
310
-
311
-
312
-
313
-
314
-
315
-
316
-
317
-
318
-
319
-
320
-
321
-
322
-
323
-
324
-
325
-
326
-
327
-
328
-
329
-
330
-
331
-
332
-
333
-
334
-
335
-
336
-
337
-
338
-
339
-
340
-
341
-
342
 |
 |

178
Director Compensation
Non-employee directors receive part of their compensation in the form of
deferred stock awards that vest in two years and may elect to receive part of
their retainer in the form of a stock payment, which they may elect to defer.
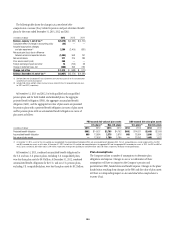
A summary of the status of Citigroup’s unvested stock awards that are not
subject to variable accounting at December 31, 2013, and changes during the
12 months ended December 31, 2013, are presented below:
Unvested stock awards Shares
Weighted-average
grant date
fair value
per share
Unvested at January 1, 2013 63,976,925 $37.62
New awards 19,619,715 43.96
Cancelled awards (2,007,674) 35.89
Vested awards (1) (26,438,206) 38.83
Unvested at December 31, 2013 55,150,760 $39.37
(1) The weighted-average fair value of the vestings during 2013 was approximately $41.89 per share.
A summary of the status of Citigroup’s unvested stock awards that are
subject to variable accounting at December 31, 2013, and changes during the
12 months ended December 31, 2013, are presented below:
Unvested stock awards Shares
Weighted-
average award
issuance fair
value per share
Unvested at January 1, 2013 5,964,224 $42.50
New awards 1,975,174 43.94
Cancelled awards (65,409) 47.71
Vested awards (1) (1,887,967) 42.52
Unvested at December 31, 2013 5,986,022 $42.91
(1) The weighted-average fair value of the vestings during 2013 was approximately $41.41 per share.
At December 31, 2013, there was $694 million of total unrecognized
compensation cost related to unvested stock awards, net of the forfeiture
provision. That cost is expected to be recognized over a weighted-average
period of 1.9 years. However, the cost of awards subject to variable accounting
will fluctuate with changes in Citigroup’s common stock price.
Stock Option Programs
Beginning in 2009, directors were no longer able to elect to receive any of
their compensation in the form of stock options, and the Company no longer
grants stock options to employees as part of its annual incentive award
programs (this last occurred when certain CAP participants were permitted to
elect to receive stock options in lieu of restricted or deferred awards made in
2009). Citigroup still grants stock options to employees on occasion, as sign-
on awards or as retention awards, as referenced above. All stock options are
granted on Citigroup common stock with exercise prices that are no less than
the fair market value at the time of grant. Vesting periods and other terms
and conditions of sign-on and retention option grants tend to vary by grant.
On February 14, 2011, Citigroup granted options exercisable for
approximately 2.9 million shares of Citigroup common stock to certain of
its executive officers. The options have six-year terms and vest in three equal
annual installments beginning on February 14, 2012. The exercise price
of the options is $49.10, which was the closing price of a share of Citigroup
common stock on the grant date. On any exercise of the options before the
fifth anniversary of the grant date, the shares received on exercise (net of the
amount required to pay taxes and the exercise price) are subject to a one-
year transfer restriction.
On April 20, 2010, Citigroup made an option grant to a group of
employees who were not eligible for the October 29, 2009 broad-based grant
described below. The options were awarded with an exercise price equal to
the NYSE closing price of a share of Citigroup common stock on the trading
day immediately preceding the date of grant ($48.80). The options vested in
three annual installments beginning on October 29, 2010. The options have
a six-year term.
On October 29, 2009, Citigroup made a broad-based option grant to
employees worldwide. The options have a six-year term, and generally
vested in three equal installments over three years, beginning on the first
anniversary of the grant date. The options were awarded with an exercise
price equal to the NYSE closing price on the trading day immediately
preceding the date of grant ($40.80). The CEO and other employees whose
2009 compensation was subject to structures approved by the Special Master
did not participate in this grant.
In January 2009, members of Citigroup’s Management Executive
Committee received 10% of their awards as performance-based stock options,
with an exercise price that placed the awards significantly “out of the
money” on the date of grant. Half of each executive’s options has an exercise
price of $178.50 and half has an exercise price of $106.10. The options were
granted on a day on which the NYSE closing price of a share of Citigroup
common stock was $45.30. The options have a 10-year term and vested
ratably over a four-year period.
Generally, all other options granted from 2003 through 2009 have six-year
terms and vested ratably over three- or four-year periods; however, options
granted to directors provided for cliff vesting. All outstanding options granted
prior to 2009 are significantly “out of the money”.