Citibank 2013 Annual Report Download - page 231
Download and view the complete annual report
Please find page 231 of the 2013 Citibank annual report below. You can navigate through the pages in the report by either clicking on the pages listed below, or by using the keyword search tool below to find specific information within the annual report.-
 1
1 -
2
-
3
-
4
-
5
-
6
-
7
-
8
-
9
-
10
-
11
-
12
-
13
-
14
-
15
-
16
-
17
-
18
-
19
-
20
-
21
-
22
-
23
-
24
-
25
-
26
-
27
-
28
-
29
-
30
-
31
-
32
-
33
-
34
-
35
-
36
-
37
-
38
-
39
-
40
-
41
-
42
-
43
-
44
-
45
-
46
-
47
-
48
-
49
-
50
-
51
-
52
-
53
-
54
-
55
-
56
-
57
-
58
-
59
-
60
-
61
-
62
-
63
-
64
-
65
-
66
-
67
-
68
-
69
-
70
-
71
-
72
-
73
-
74
-
75
-
76
-
77
-
78
-
79
-
80
-
81
-
82
-
83
-
84
-
85
-
86
-
87
-
88
-
89
-
90
-
91
-
92
-
93
-
94
-
95
-
96
-
97
-
98
-
99
-
100
-
101
-
102
-
103
-
104
-
105
-
106
-
107
-
108
-
109
-
110
-
111
-
112
-
113
-
114
-
115
-
116
-
117
-
118
-
119
-
120
-
121
-
122
-
123
-
124
-
125
-
126
-
127
-
128
-
129
-
130
-
131
-
132
-
133
-
134
-
135
-
136
-
137
-
138
-
139
-
140
-
141
-
142
-
143
-
144
-
145
-
146
-
147
-
148
-
149
-
150
-
151
-
152
-
153
-
154
-
155
-
156
-
157
-
158
-
159
-
160
-
161
-
162
-
163
-
164
-
165
-
166
-
167
-
168
-
169
-
170
-
171
-
172
-
173
-
174
-
175
-
176
-
177
-
178
-
179
-
180
-
181
-
182
-
183
-
184
-
185
-
186
-
187
-
188
-
189
-
190
-
191
-
192
-
193
-
194
-
195
-
196
-
197
-
198
-
199
-
200
-
201
-
202
-
203
-
204
-
205
-
206
-
207
-
208
-
209
-
210
-
211
-
212
-
213
-
214
-
215
-
216
-
217
-
218
-
219
-
220
-
 221
221 -
 222
222 -
 223
223 -
 224
224 -
 225
225 -
 226
226 -
 227
227 -
 228
228 -
 229
229 -
 230
230 -
 231
231 -
 232
232 -
 233
233 -
 234
234 -
 235
235 -
 236
236 -
 237
237 -
 238
238 -
 239
239 -
 240
240 -
 241
241 -
242
-
243
-
244
-
245
-
246
-
247
-
248
-
249
-
250
-
251
-
252
-
253
-
254
-
255
-
256
-
257
-
258
-
259
-
260
-
261
-
262
-
263
-
264
-
265
-
266
-
267
-
268
-
269
-
270
-
271
-
272
-
273
-
274
-
275
-
276
-
277
-
278
-
279
-
280
-
281
-
282
-
283
-
284
-
285
-
286
-
287
-
288
-
289
-
290
-
291
-
292
-
293
-
294
-
295
-
296
-
297
-
298
-
299
-
300
-
301
-
302
-
303
-
304
-
305
-
306
-
307
-
308
-
309
-
310
-
311
-
312
-
313
-
314
-
315
-
316
-
317
-
318
-
319
-
320
-
321
-
322
-
323
-
324
-
325
-
326
-
327
-
328
-
329
-
330
-
331
-
332
-
333
-
334
-
335
-
336
-
337
-
338
-
339
-
340
-
341
-
342
 |
 |

213
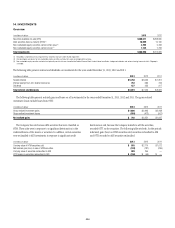
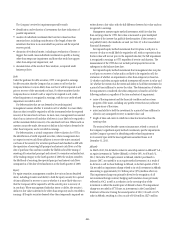
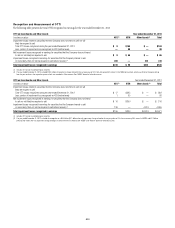
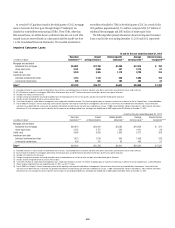
Recognition and Measurement of OTTI
The following table presents the total OTTI recognized in earnings for the year ended December 31, 2013:
OTTI on Investments and Other Assets Year ended December 31, 2013
In millions of dollars AFS (1) HTM Other Assets (2) Total
Impairment losses related to securities that the Company does not intend to sell nor will
likely be required to sell:
Total OTTI losses recognized during the year ended December 31, 2013 $ 9 $154 $ — $163
Less: portion of impairment loss recognized in AOCI (before taxes) — 98 — 98
Net impairment losses recognized in earnings for securities that the Company does not intend
to sell nor will likely be required to sell $ 9 $ 56 $ — $ 65
Impairment losses recognized in earnings for securities that the Company intends to sell
or more-likely-than-not will be required to sell before recovery (2) 269 — 201 470
Total impairment losses recognized in earnings $278 $ 56 $201 $535
(1) Includes OTTI on non-marketable equity securities.
(2) The year ended December 31, 2013 included $192 million of impairment charges related to the carrying value of Citi’s then-remaining 35% interest in the MSSB joint venture, which was offset by the equity pickup
from the joint venture in the respective quarter, which was recorded in Other revenue. See “MSSB” above for further discussion.
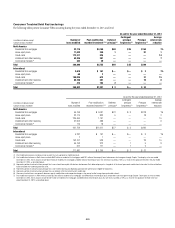
OTTI on Investments and Other Assets Year ended December 31, 2012
In millions of dollars AFS (1) HTM Other Assets (2) Total
Impairment losses related to securities that the Company does not intend to sell nor will
likely be required to sell:
Total OTTI losses recognized during the year ended December 31, 2012 $ 17 $365 $ — $ 382
Less: portion of impairment loss recognized in AOCI (before taxes) 1 65 — 66
Net impairment losses recognized in earnings for securities that the Company does not intend
to sell nor will likely be required to sell $ 16 $300 $ — $ 316
Impairment losses recognized in earnings for securities that the Company intends to sell
or more-likely-than-not will be required to sell before recovery (2) 139 — 4,516 4,655
Total impairment losses recognized in earnings $155 $300 $4,516 $4,971
(1) Includes OTTI on non-marketable equity securities.
(2) The year ended December 31, 2012 included the recognition of a $3.4 billion ($2.1 billion after-tax) impairment charge related to the carrying value of Citi’s then-remaining 35% interest in MSSB, and $1.2 billion
pretax ($763 million after-tax) impairment charge relating to its total investment in Akbank. See “MSSB” and “Akbank” above for further discussion.