Citibank 2013 Annual Report Download - page 30
Download and view the complete annual report
Please find page 30 of the 2013 Citibank annual report below. You can navigate through the pages in the report by either clicking on the pages listed below, or by using the keyword search tool below to find specific information within the annual report.-
 1
1 -
2
-
3
-
4
-
5
-
6
-
7
-
8
-
9
-
10
-
11
-
12
-
13
-
14
-
15
-
16
-
17
-
18
-
19
-
 20
20 -
 21
21 -
 22
22 -
 23
23 -
 24
24 -
 25
25 -
 26
26 -
 27
27 -
 28
28 -
 29
29 -
 30
30 -
 31
31 -
 32
32 -
 33
33 -
 34
34 -
 35
35 -
 36
36 -
 37
37 -
 38
38 -
 39
39 -
 40
40 -
41
-
42
-
43
-
44
-
45
-
46
-
47
-
48
-
49
-
50
-
51
-
52
-
53
-
54
-
55
-
56
-
57
-
58
-
59
-
60
-
61
-
62
-
63
-
64
-
65
-
66
-
67
-
68
-
69
-
70
-
71
-
72
-
73
-
74
-
75
-
76
-
77
-
78
-
79
-
80
-
81
-
82
-
83
-
84
-
85
-
86
-
87
-
88
-
89
-
90
-
91
-
92
-
93
-
94
-
95
-
96
-
97
-
98
-
99
-
100
-
101
-
102
-
103
-
104
-
105
-
106
-
107
-
108
-
109
-
110
-
111
-
112
-
113
-
114
-
115
-
116
-
117
-
118
-
119
-
120
-
121
-
122
-
123
-
124
-
125
-
126
-
127
-
128
-
129
-
130
-
131
-
132
-
133
-
134
-
135
-
136
-
137
-
138
-
139
-
140
-
141
-
142
-
143
-
144
-
145
-
146
-
147
-
148
-
149
-
150
-
151
-
152
-
153
-
154
-
155
-
156
-
157
-
158
-
159
-
160
-
161
-
162
-
163
-
164
-
165
-
166
-
167
-
168
-
169
-
170
-
171
-
172
-
173
-
174
-
175
-
176
-
177
-
178
-
179
-
180
-
181
-
182
-
183
-
184
-
185
-
186
-
187
-
188
-
189
-
190
-
191
-
192
-
193
-
194
-
195
-
196
-
197
-
198
-
199
-
200
-
201
-
202
-
203
-
204
-
205
-
206
-
207
-
208
-
209
-
210
-
211
-
212
-
213
-
214
-
215
-
216
-
217
-
218
-
219
-
220
-
221
-
222
-
223
-
224
-
225
-
226
-
227
-
228
-
229
-
230
-
231
-
232
-
233
-
234
-
235
-
236
-
237
-
238
-
239
-
240
-
241
-
242
-
243
-
244
-
245
-
246
-
247
-
248
-
249
-
250
-
251
-
252
-
253
-
254
-
255
-
256
-
257
-
258
-
259
-
260
-
261
-
262
-
263
-
264
-
265
-
266
-
267
-
268
-
269
-
270
-
271
-
272
-
273
-
274
-
275
-
276
-
277
-
278
-
279
-
280
-
281
-
282
-
283
-
284
-
285
-
286
-
287
-
288
-
289
-
290
-
291
-
292
-
293
-
294
-
295
-
296
-
297
-
298
-
299
-
300
-
301
-
302
-
303
-
304
-
305
-
306
-
307
-
308
-
309
-
310
-
311
-
312
-
313
-
314
-
315
-
316
-
317
-
318
-
319
-
320
-
321
-
322
-
323
-
324
-
325
-
326
-
327
-
328
-
329
-
330
-
331
-
332
-
333
-
334
-
335
-
336
-
337
-
338
-
339
-
340
-
341
-
342
 |
 |

12
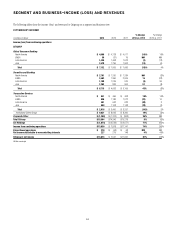
SEGMENT AND BUSINESS—INCOME (LOSS) AND REVENUES
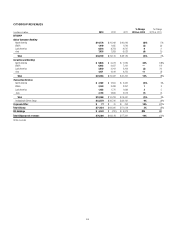
The following tables show the income (loss) and revenues for Citigroup on a segment and business view:
CITIGROUP INCOME
In millions of dollars 2013 2012 2011
% Change
2013 vs. 2012
% Change
2012 vs. 2011
Income (loss) from continuing operations
CITICORP
Global Consumer Banking
North America $ 4,068 $ 4,728 $ 4,011 (14)% 18%
EMEA 59 (37) 79 NM NM
Latin America 1,435 1,468 1,673 (2) (12)
Asia 1,570 1,796 1,903 (13) (6)
Total $ 7,132 $ 7,955 $ 7,666 (10)% 4%
Securities and Banking
North America $ 2,701 $ 1,250 $ 1,284 NM (3)%
EMEA 1,562 1,360 2,005 15 (32)
Latin America 1,189 1,249 916 (5) 36
Asia 1,263 834 904 51 (8)
Total $ 6,715 $ 4,693 $ 5,109 43% (8)%
Transaction Services
North America $ 541 $ 466 $ 408 16% 14%
EMEA 926 1,184 1,072 (22) 10
Latin America 451 642 623 (30) 3
Asia 998 1,108 1,148 (10) (3)
Total $ 2,916 $ 3,400 $ 3,251 (14)% 5%
Institutional Clients Group $ 9,631 $ 8,093 $ 8,360 19% (3)%
Corporate/Other $ (1,259) $ (1,702) $ (808) 26% NM
Total Citicorp $15,504 $14,346 $15,218 8% (6)%
Citi Holdings $ (1,874) $ (6,528) $ (4,071) 71% (60)%
Income from continuing operations $13,630 $ 7,818 $11,147 74% (30)%
Discontinued operations $ 270 $ (58) $ 68 NM NM
Net income attributable to noncontrolling interests 227 219 148 4% 48%
Citigroup’s net income $13,673 $ 7,541 $11,067 81% (32)%
NM Not meaningful