Citibank 2013 Annual Report Download - page 330
Download and view the complete annual report
Please find page 330 of the 2013 Citibank annual report below. You can navigate through the pages in the report by either clicking on the pages listed below, or by using the keyword search tool below to find specific information within the annual report.-
 1
1 -
2
-
3
-
4
-
5
-
6
-
7
-
8
-
9
-
10
-
11
-
12
-
13
-
14
-
15
-
16
-
17
-
18
-
19
-
20
-
21
-
22
-
23
-
24
-
25
-
26
-
27
-
28
-
29
-
30
-
31
-
32
-
33
-
34
-
35
-
36
-
37
-
38
-
39
-
40
-
41
-
42
-
43
-
44
-
45
-
46
-
47
-
48
-
49
-
50
-
51
-
52
-
53
-
54
-
55
-
56
-
57
-
58
-
59
-
60
-
61
-
62
-
63
-
64
-
65
-
66
-
67
-
68
-
69
-
70
-
71
-
72
-
73
-
74
-
75
-
76
-
77
-
78
-
79
-
80
-
81
-
82
-
83
-
84
-
85
-
86
-
87
-
88
-
89
-
90
-
91
-
92
-
93
-
94
-
95
-
96
-
97
-
98
-
99
-
100
-
101
-
102
-
103
-
104
-
105
-
106
-
107
-
108
-
109
-
110
-
111
-
112
-
113
-
114
-
115
-
116
-
117
-
118
-
119
-
120
-
121
-
122
-
123
-
124
-
125
-
126
-
127
-
128
-
129
-
130
-
131
-
132
-
133
-
134
-
135
-
136
-
137
-
138
-
139
-
140
-
141
-
142
-
143
-
144
-
145
-
146
-
147
-
148
-
149
-
150
-
151
-
152
-
153
-
154
-
155
-
156
-
157
-
158
-
159
-
160
-
161
-
162
-
163
-
164
-
165
-
166
-
167
-
168
-
169
-
170
-
171
-
172
-
173
-
174
-
175
-
176
-
177
-
178
-
179
-
180
-
181
-
182
-
183
-
184
-
185
-
186
-
187
-
188
-
189
-
190
-
191
-
192
-
193
-
194
-
195
-
196
-
197
-
198
-
199
-
200
-
201
-
202
-
203
-
204
-
205
-
206
-
207
-
208
-
209
-
210
-
211
-
212
-
213
-
214
-
215
-
216
-
217
-
218
-
219
-
220
-
221
-
222
-
223
-
224
-
225
-
226
-
227
-
228
-
229
-
230
-
231
-
232
-
233
-
234
-
235
-
236
-
237
-
238
-
239
-
240
-
241
-
242
-
243
-
244
-
245
-
246
-
247
-
248
-
249
-
250
-
251
-
252
-
253
-
254
-
255
-
256
-
257
-
258
-
259
-
260
-
261
-
262
-
263
-
264
-
265
-
266
-
267
-
268
-
269
-
270
-
271
-
272
-
273
-
274
-
275
-
276
-
277
-
278
-
279
-
280
-
281
-
282
-
283
-
284
-
285
-
286
-
287
-
288
-
289
-
290
-
291
-
292
-
293
-
294
-
295
-
296
-
297
-
298
-
299
-
300
-
301
-
302
-
303
-
304
-
305
-
306
-
307
-
308
-
309
-
310
-
311
-
312
-
313
-
314
-
315
-
316
-
317
-
318
-
319
-
 320
320 -
 321
321 -
 322
322 -
 323
323 -
 324
324 -
 325
325 -
 326
326 -
 327
327 -
 328
328 -
 329
329 -
 330
330 -
 331
331 -
 332
332 -
 333
333 -
 334
334 -
 335
335 -
 336
336 -
 337
337 -
 338
338 -
 339
339 -
 340
340 -
341
-
342
 |
 |

312
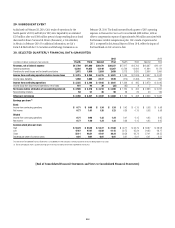
29. SUBSEQUENT EVENT
As disclosed on February 28, 2014, Citi’s results of operations for the
fourth quarter of 2013 and full year 2013 were impacted by an estimated
$235 million after-tax ($360 million pretax) charge resulting from a fraud
discovered in Banco Nacional de Mexico (Banamex), a Citi subsidiary
in Mexico, in February 2014. For additional information, see Citi’s
Form 8-K filed with the U.S. Securities and Exchange Commission on
February 28, 2014. The fraud increased fourth quarter of 2013 operating
expenses in Transaction Services by an estimated $400 million, with an
offset to compensation expense of approximately $40 million associated with
the Banamex variable compensation plan. Citi’s results of operations for
2013, as reported in this Annual Report of Form 10-K, reflect the impact of
the fraud based on Citi’s review to date.
30. SELECTED QUARTERLY FINANCIAL DATA (UNAUDITED)
2013 2012
In millions of dollars, except per share amounts Fourth Third Second First Fourth Third Second First
Revenues, net of interest expense $17,780 $17,880 $20,479 $20,227 $17,917 $13,703 $18,387 $19,121
Operating expenses 12,293 11,655 12,140 12,267 13,709 12,092 11,994 12,179
Provisions for credit losses and for benefits and claims 2,072 1,959 2,024 2,459 3,113 2,620 2,696 2,900
Income from continuing operations before income taxes $ 3,415 $ 4,266 $ 6,315 $ 5,501 $ 1,095 $ (1,009) $ 3,697 $ 4,042
Income taxes (benefits) 1,090 1,080 2,127 1,570 (214) (1,494) 718 997
Income from continuing operations $ 2,325 $ 3,186 $ 4,188 $ 3,931 $ 1,309 $ 485 $ 2,979 $ 3,045
Income (loss) from discontinued operations, net of taxes 181 92 30 (33) (85) 8 7 12
Net income before attribution of noncontrolling interests $ 2,506 $ 3,278 $ 4,218 $ 3,898 $ 1,224 $ 493 $ 2,986 $ 3,057
Noncontrolling interests 50 51 36 90 28 25 40 126
Citigroup’s net income $ 2,456 $ 3,227 $ 4,182 $ 3,808 $ 1,196 $ 468 $ 2,946 $ 2,931
Earnings per share (1)
Basic
Income from continuing operations $ 0.71 $ 0.98 $ 1.34 $ 1.24 $ 0.42 $ 0.15 $ 0.98 $ 0.98
Net income 0.77 1.01 1.35 1.23 0.39 0.15 0.98 0.98
Diluted
Income from continuing operations 0.71 0.98 1.33 1.24 0.41 0.15 0.95 0.95
Net income 0.77 1.00 1.34 1.23 0.38 0.15 0.95 0.95
Common stock price per share
High $ 53.29 $ 53.00 $ 53.27 $ 47.60 $ 40.17 $ 34.79 $ 36.87 $ 38.08
Low 47.67 47.67 42.50 41.15 32.75 25.24 24.82 28.17
Close 52.11 48.51 47.97 44.24 39.56 32.72 27.41 36.55
Dividends per share of common stock 0.01 0.01 0.01 0.01 0.01 0.01 0.01 0.01
This Note to the Consolidated Financial Statements is unaudited due to the Company’s individual quarterly results not being subject to an audit.
(1) Due to averaging of shares, quarterly earnings per share may not add up to the totals reported for the full year.
[End of Consolidated Financial Statements and Notes to Consolidated Financial Statements]