Citibank 2013 Annual Report Download - page 101
Download and view the complete annual report
Please find page 101 of the 2013 Citibank annual report below. You can navigate through the pages in the report by either clicking on the pages listed below, or by using the keyword search tool below to find specific information within the annual report.-
 1
1 -
2
-
3
-
4
-
5
-
6
-
7
-
8
-
9
-
10
-
11
-
12
-
13
-
14
-
15
-
16
-
17
-
18
-
19
-
20
-
21
-
22
-
23
-
24
-
25
-
26
-
27
-
28
-
29
-
30
-
31
-
32
-
33
-
34
-
35
-
36
-
37
-
38
-
39
-
40
-
41
-
42
-
43
-
44
-
45
-
46
-
47
-
48
-
49
-
50
-
51
-
52
-
53
-
54
-
55
-
56
-
57
-
58
-
59
-
60
-
61
-
62
-
63
-
64
-
65
-
66
-
67
-
68
-
69
-
70
-
71
-
72
-
73
-
74
-
75
-
76
-
77
-
78
-
79
-
80
-
81
-
82
-
83
-
84
-
85
-
86
-
87
-
88
-
89
-
90
-
 91
91 -
 92
92 -
 93
93 -
 94
94 -
 95
95 -
 96
96 -
 97
97 -
 98
98 -
 99
99 -
 100
100 -
 101
101 -
 102
102 -
 103
103 -
 104
104 -
 105
105 -
 106
106 -
 107
107 -
 108
108 -
 109
109 -
 110
110 -
 111
111 -
112
-
113
-
114
-
115
-
116
-
117
-
118
-
119
-
120
-
121
-
122
-
123
-
124
-
125
-
126
-
127
-
128
-
129
-
130
-
131
-
132
-
133
-
134
-
135
-
136
-
137
-
138
-
139
-
140
-
141
-
142
-
143
-
144
-
145
-
146
-
147
-
148
-
149
-
150
-
151
-
152
-
153
-
154
-
155
-
156
-
157
-
158
-
159
-
160
-
161
-
162
-
163
-
164
-
165
-
166
-
167
-
168
-
169
-
170
-
171
-
172
-
173
-
174
-
175
-
176
-
177
-
178
-
179
-
180
-
181
-
182
-
183
-
184
-
185
-
186
-
187
-
188
-
189
-
190
-
191
-
192
-
193
-
194
-
195
-
196
-
197
-
198
-
199
-
200
-
201
-
202
-
203
-
204
-
205
-
206
-
207
-
208
-
209
-
210
-
211
-
212
-
213
-
214
-
215
-
216
-
217
-
218
-
219
-
220
-
221
-
222
-
223
-
224
-
225
-
226
-
227
-
228
-
229
-
230
-
231
-
232
-
233
-
234
-
235
-
236
-
237
-
238
-
239
-
240
-
241
-
242
-
243
-
244
-
245
-
246
-
247
-
248
-
249
-
250
-
251
-
252
-
253
-
254
-
255
-
256
-
257
-
258
-
259
-
260
-
261
-
262
-
263
-
264
-
265
-
266
-
267
-
268
-
269
-
270
-
271
-
272
-
273
-
274
-
275
-
276
-
277
-
278
-
279
-
280
-
281
-
282
-
283
-
284
-
285
-
286
-
287
-
288
-
289
-
290
-
291
-
292
-
293
-
294
-
295
-
296
-
297
-
298
-
299
-
300
-
301
-
302
-
303
-
304
-
305
-
306
-
307
-
308
-
309
-
310
-
311
-
312
-
313
-
314
-
315
-
316
-
317
-
318
-
319
-
320
-
321
-
322
-
323
-
324
-
325
-
326
-
327
-
328
-
329
-
330
-
331
-
332
-
333
-
334
-
335
-
336
-
337
-
338
-
339
-
340
-
341
-
342
 |
 |
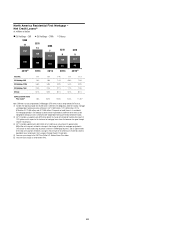
83
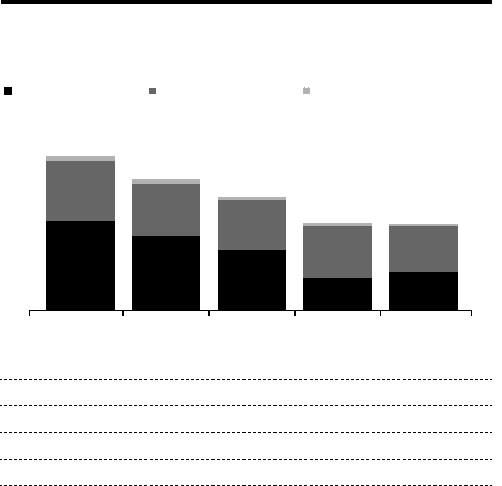
4Q’13(3)
3Q’132Q’131Q’134Q’12(2)
225
152
11
188
130
13
152
127
7
81
130
8
95
117
5
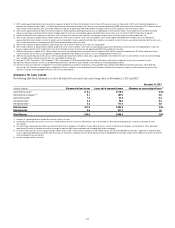
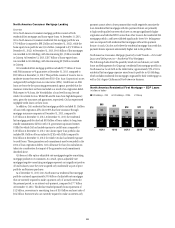
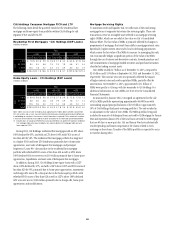
North America Residential First Mortgage —
Net Credit Losses(1)
In millions of dollars
Citi Holdings - CMI Citi Holdings - CFNA Citicorp
$388
$331
$286
$218
$218
Total NCL 1.7% 1.5% 1.4% 1.1% 1.1%
Citi Holdings CMI 1.8% 1.6% 1.4% 0.8% 1.0%
Citi Holdings CFNA 5.6% 5.0% 5.0% 5.3% 5.0%
Citi Holdings Total 2.5% 2.3% 2.1% 1.7% 1.9%
Citicorp 0.1% 0.2% 0.1% 0.1% 0.1%
S&P/Case Shiller Home
Price Index(4) 7.0% 10.7% 12.0% 13.3% 11.8%(5)
Note: CMI refers to loans originated by CitiMortgage. CFNA refers to loans originated by CitiFinancial.
(1) Includes the following charge-offs related to Citi’s fulfillment of its obligations under the national mortgage
and independent foreclosure review settlements: 4Q’12, $32 million; 1Q’13, $25 million; 2Q’13,
$18 million; 3Q’13, $8 million; and 4Q’13, $6 million. Citi expects net credit losses in its residential
first mortgage portfolio in Citi Holdings to continue to be impacted by its fulfillment of the terms of the
independent foreclosure review settlement. See “Independent Foreclosure Review Settlement” below.
(2) 4Q’12 excludes an approximately $10 million benefit to charge-offs related to finalizing the impact of
OCC guidance with respect to the treatment of mortgage loans where the borrower has gone through
Chapter 7 bankruptcy.
(3) 4Q’13 excludes approximately $84 million of net credit losses consisting of (i) approximately
$69 million of charge-offs related to a change in the charge-off policy for mortgages originated in
CitiFinancial to more closely align to policies used in the CitiMortgage business, and (ii) approximately
$15 million of charge-offs related to a change in the estimate of net credit losses related to collateral
dependent loans to borrowers that have gone through Chapter 7 bankruptcy.
(4) Year-over-year change in the S&P/Case-Shiller U.S. National Home Price Index.
(5) Year-over-year change as of November 2013.