Citibank 2013 Annual Report Download - page 200
Download and view the complete annual report
Please find page 200 of the 2013 Citibank annual report below. You can navigate through the pages in the report by either clicking on the pages listed below, or by using the keyword search tool below to find specific information within the annual report.-
 1
1 -
2
-
3
-
4
-
5
-
6
-
7
-
8
-
9
-
10
-
11
-
12
-
13
-
14
-
15
-
16
-
17
-
18
-
19
-
20
-
21
-
22
-
23
-
24
-
25
-
26
-
27
-
28
-
29
-
30
-
31
-
32
-
33
-
34
-
35
-
36
-
37
-
38
-
39
-
40
-
41
-
42
-
43
-
44
-
45
-
46
-
47
-
48
-
49
-
50
-
51
-
52
-
53
-
54
-
55
-
56
-
57
-
58
-
59
-
60
-
61
-
62
-
63
-
64
-
65
-
66
-
67
-
68
-
69
-
70
-
71
-
72
-
73
-
74
-
75
-
76
-
77
-
78
-
79
-
80
-
81
-
82
-
83
-
84
-
85
-
86
-
87
-
88
-
89
-
90
-
91
-
92
-
93
-
94
-
95
-
96
-
97
-
98
-
99
-
100
-
101
-
102
-
103
-
104
-
105
-
106
-
107
-
108
-
109
-
110
-
111
-
112
-
113
-
114
-
115
-
116
-
117
-
118
-
119
-
120
-
121
-
122
-
123
-
124
-
125
-
126
-
127
-
128
-
129
-
130
-
131
-
132
-
133
-
134
-
135
-
136
-
137
-
138
-
139
-
140
-
141
-
142
-
143
-
144
-
145
-
146
-
147
-
148
-
149
-
150
-
151
-
152
-
153
-
154
-
155
-
156
-
157
-
158
-
159
-
160
-
161
-
162
-
163
-
164
-
165
-
166
-
167
-
168
-
169
-
170
-
171
-
172
-
173
-
174
-
175
-
176
-
177
-
178
-
179
-
180
-
181
-
182
-
183
-
184
-
185
-
186
-
187
-
188
-
189
-
 190
190 -
 191
191 -
 192
192 -
 193
193 -
 194
194 -
 195
195 -
 196
196 -
 197
197 -
 198
198 -
 199
199 -
 200
200 -
 201
201 -
 202
202 -
 203
203 -
 204
204 -
 205
205 -
 206
206 -
 207
207 -
 208
208 -
 209
209 -
 210
210 -
211
-
212
-
213
-
214
-
215
-
216
-
217
-
218
-
219
-
220
-
221
-
222
-
223
-
224
-
225
-
226
-
227
-
228
-
229
-
230
-
231
-
232
-
233
-
234
-
235
-
236
-
237
-
238
-
239
-
240
-
241
-
242
-
243
-
244
-
245
-
246
-
247
-
248
-
249
-
250
-
251
-
252
-
253
-
254
-
255
-
256
-
257
-
258
-
259
-
260
-
261
-
262
-
263
-
264
-
265
-
266
-
267
-
268
-
269
-
270
-
271
-
272
-
273
-
274
-
275
-
276
-
277
-
278
-
279
-
280
-
281
-
282
-
283
-
284
-
285
-
286
-
287
-
288
-
289
-
290
-
291
-
292
-
293
-
294
-
295
-
296
-
297
-
298
-
299
-
300
-
301
-
302
-
303
-
304
-
305
-
306
-
307
-
308
-
309
-
310
-
311
-
312
-
313
-
314
-
315
-
316
-
317
-
318
-
319
-
320
-
321
-
322
-
323
-
324
-
325
-
326
-
327
-
328
-
329
-
330
-
331
-
332
-
333
-
334
-
335
-
336
-
337
-
338
-
339
-
340
-
341
-
342
 |
 |

182
Contributions
The Company’s funding practice for U.S. and non-U.S. pension plans is
generally to fund to minimum funding requirements in accordance with
applicable local laws and regulations. The Company may increase its
contributions above the minimum required contribution, if appropriate. In
addition, management has the ability to change its funding practices. For
the U.S. pension plans, there were no required minimum cash contributions
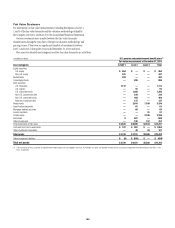
for 2013 or 2012. The following table summarizes the actual Company
contributions for the years ended December 31, 2013 and 2012, as well as
estimated expected Company contributions for 2014. Expected contributions
are subject to change since contribution decisions are affected by various
factors, such as market performance and regulatory requirements.
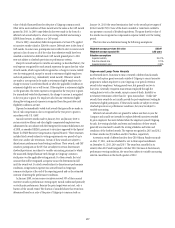
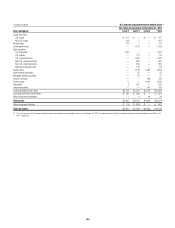
Pension plans (1) Postretirement plans (1)
U.S. plans (2) Non-U.S. plans U.S. plans Non-U.S. plans
In millions of dollars 2014 2013 2012 2014 2013 2012 2014 2013 2012 2014 2013 2012
Cash contributions paid by the Company $— $— $— $116 $308 $270 $— $— $— $ 5 $251 $88
Benefits paid directly by the Company 54 51 54 49 49 82 62 52 54 6 54
Total Company contributions $54 $51 $54 $165 $357 $352 $62 $52 $54 $11 $256 $92
(1) Payments reported for 2014 are expected amounts.
(2) The U.S. pension plans include benefits paid directly by the Company for the nonqualified pension plans.
The estimated net actuarial loss and prior service cost that will be
amortized from Accumulated other comprehensive income (loss) into
net expense in 2014 are approximately $181 million and $3 million,
respectively, for defined benefit pension plans. For postretirement plans, the
estimated 2014 net actuarial loss and prior service cost amortizations are
approximately $31 million and $(12) million, respectively.
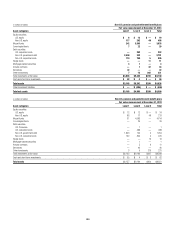
The following table summarizes the funded status and amounts
recognized in the Consolidated Balance Sheet for the Company’s U.S.
qualified and nonqualified pension plans, postretirement plans and plans
outside the United States.
Net Amount Recognized
Pension plans Postretirement plans
U.S. plans Non-U.S. plans U.S. plans Non-U.S. plans
In millions of dollars 2013 2012 2013 2012 2013 2012 2013 2012
Change in projected benefit obligation
Qualified plans
Projected benefit obligation at beginning of year $13,268 $12,377 $7,399 $6,262 $1,072 $1,127 $2,002 $1,368
Cumulative effect of change in accounting policy (1) (368) —385 ———81 —
Benefits earned during the year 812 210 199 ——43 29
Interest cost on benefit obligation 538 565 384 367 33 44 146 116
Plan amendments —(13) (28) 17 ——(171) —
Actuarial (gain) loss (671) 965 (733) 923 (253) (24) (617) 457
Benefits paid, net of participants’ contributions (661) (638) (296) (306) (85) (85) (64) (54)
Expected government subsidy ————13 10 ——
Settlements ——(57) (254) ——(2) —
Curtailment (gain) loss 23 —(2) (8) ——(3) —
Special/contractual termination benefits ——81————
Foreign exchange impact and other ——(76) 198 ——(4) 86
Qualified plans $12,137 $13,268 $7,194 $7,399 $ 780 $1,072 $1,411 $2,002
Nonqualified plans (2) $ 692 $ 769 $ — $ — $ — $ — $ — $ —
Projected benefit obligation at year end $12,829 $14,037 $7,194 $7,399 $ 780 $1,072 $1,411 $2,002
(1) See Note 1 to the Consolidated Financial Statements for additional information on the change in accounting policy.
(2) These plans are unfunded.