Citibank 2013 Annual Report Download - page 57
Download and view the complete annual report
Please find page 57 of the 2013 Citibank annual report below. You can navigate through the pages in the report by either clicking on the pages listed below, or by using the keyword search tool below to find specific information within the annual report.-
 1
1 -
2
-
3
-
4
-
5
-
6
-
7
-
8
-
9
-
10
-
11
-
12
-
13
-
14
-
15
-
16
-
17
-
18
-
19
-
20
-
21
-
22
-
23
-
24
-
25
-
26
-
27
-
28
-
29
-
30
-
31
-
32
-
33
-
34
-
35
-
36
-
37
-
38
-
39
-
40
-
41
-
42
-
43
-
44
-
45
-
46
-
 47
47 -
 48
48 -
 49
49 -
 50
50 -
 51
51 -
 52
52 -
 53
53 -
 54
54 -
 55
55 -
 56
56 -
 57
57 -
 58
58 -
 59
59 -
 60
60 -
 61
61 -
 62
62 -
 63
63 -
 64
64 -
 65
65 -
 66
66 -
 67
67 -
68
-
69
-
70
-
71
-
72
-
73
-
74
-
75
-
76
-
77
-
78
-
79
-
80
-
81
-
82
-
83
-
84
-
85
-
86
-
87
-
88
-
89
-
90
-
91
-
92
-
93
-
94
-
95
-
96
-
97
-
98
-
99
-
100
-
101
-
102
-
103
-
104
-
105
-
106
-
107
-
108
-
109
-
110
-
111
-
112
-
113
-
114
-
115
-
116
-
117
-
118
-
119
-
120
-
121
-
122
-
123
-
124
-
125
-
126
-
127
-
128
-
129
-
130
-
131
-
132
-
133
-
134
-
135
-
136
-
137
-
138
-
139
-
140
-
141
-
142
-
143
-
144
-
145
-
146
-
147
-
148
-
149
-
150
-
151
-
152
-
153
-
154
-
155
-
156
-
157
-
158
-
159
-
160
-
161
-
162
-
163
-
164
-
165
-
166
-
167
-
168
-
169
-
170
-
171
-
172
-
173
-
174
-
175
-
176
-
177
-
178
-
179
-
180
-
181
-
182
-
183
-
184
-
185
-
186
-
187
-
188
-
189
-
190
-
191
-
192
-
193
-
194
-
195
-
196
-
197
-
198
-
199
-
200
-
201
-
202
-
203
-
204
-
205
-
206
-
207
-
208
-
209
-
210
-
211
-
212
-
213
-
214
-
215
-
216
-
217
-
218
-
219
-
220
-
221
-
222
-
223
-
224
-
225
-
226
-
227
-
228
-
229
-
230
-
231
-
232
-
233
-
234
-
235
-
236
-
237
-
238
-
239
-
240
-
241
-
242
-
243
-
244
-
245
-
246
-
247
-
248
-
249
-
250
-
251
-
252
-
253
-
254
-
255
-
256
-
257
-
258
-
259
-
260
-
261
-
262
-
263
-
264
-
265
-
266
-
267
-
268
-
269
-
270
-
271
-
272
-
273
-
274
-
275
-
276
-
277
-
278
-
279
-
280
-
281
-
282
-
283
-
284
-
285
-
286
-
287
-
288
-
289
-
290
-
291
-
292
-
293
-
294
-
295
-
296
-
297
-
298
-
299
-
300
-
301
-
302
-
303
-
304
-
305
-
306
-
307
-
308
-
309
-
310
-
311
-
312
-
313
-
314
-
315
-
316
-
317
-
318
-
319
-
320
-
321
-
322
-
323
-
324
-
325
-
326
-
327
-
328
-
329
-
330
-
331
-
332
-
333
-
334
-
335
-
336
-
337
-
338
-
339
-
340
-
341
-
342
 |
 |

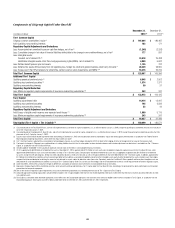
39
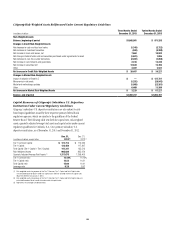
Segment Balance Sheet (1)
In millions of dollars
Global
Consumer
Banking
Institutional
Clients
Group
Corporate/Other
and
Consolidating
Eliminations (2)
Subtotal
Citicorp
Citi
Holdings
Citigroup
Parent Company-
Issued
Long-Term
Debt and
Stockholders’
Equity (3)
Total Citigroup
Consolidated
Assets
Cash and deposits with banks $ 17,787 $ 63,373 $116,763 $ 197,923 $ 967 $ — $ 198,890
Federal funds sold and securities borrowed or purchased
under agreements to resell 5,050 251,077 — 256,127 910 — 257,037
Trading account assets 6,279 275,662 242 282,183 3,745 — 285,928
Investments 30,403 114,978 150,873 296,254 12,726 — 308,980
Loans, net of unearned income and
allowance for loan losses 291,531 267,935 — 559,466 86,358 — 645,824
Other assets 53,495 72,472 45,360 171,327 12,396 — 183,723
Total assets $404,545 $1,045,497 $313,238 $1,763,280 $117,102 $ — $1,880,382
Liabilities and equity
Total deposits $332,422 $ 573,782 $ 26,099 $ 932,303 $ 35,970 $ — $ 968,273
Federal funds purchased and securities loaned or sold
under agreements to repurchase 7,847 195,664 — 203,511 1 — 203,512
Trading account liabilities 24 107,463 264 107,751 1,011 — 108,762
Short-term borrowings 291 47,117 11,322 58,730 214 — 58,944
Long-term debt 1,934 37,474 18,773 58,181 6,131 156,804 221,116
Other liabilities 18,393 76,136 11,652 106,181 7,461 — 113,642
Net inter-segment funding (lending) 43,634 7,861 243,334 294,829 66,314 (361,143) —
Total liabilities $404,545 $1,045,497 $311,444 $1,761,486 $117,102 $(204,339) $1,674,249
Total equity — — 1,794 1,794 — 204,339 206,133
Total liabilities and equity $404,545 $1,045,497 $313,238 $1,763,280 $117,102 $ — $1,880,382
(1) The supplemental information presented in the table above reflects Citigroup’s consolidated GAAP balance sheet by reporting segment as of December 31, 2013. The respective segment information depicts the assets
and liabilities managed by each segment as of such date. While this presentation is not defined by GAAP, Citi believes that these non-GAAP financial measures enhance investors’ understanding of the balance sheet
components managed by the underlying business segments, as well as the beneficial inter-relationships of the asset and liability dynamics of the balance sheet components among Citi’s business segments.
(2) Consolidating eliminations for total Citigroup and Citigroup parent company assets and liabilities are recorded within the Corporate/Other segment.
(3) The total stockholders’ equity and the majority of long-term debt of Citigroup reside in the Citigroup parent company Consolidated Balance Sheet. See Notes 18 and 19 to the Consolidated Financial Statements.
Citigroup allocates stockholders’ equity and long-term debt to its businesses through inter-segment allocations as shown above.