Citibank 2013 Annual Report Download - page 120
Download and view the complete annual report
Please find page 120 of the 2013 Citibank annual report below. You can navigate through the pages in the report by either clicking on the pages listed below, or by using the keyword search tool below to find specific information within the annual report.-
 1
1 -
2
-
3
-
4
-
5
-
6
-
7
-
8
-
9
-
10
-
11
-
12
-
13
-
14
-
15
-
16
-
17
-
18
-
19
-
20
-
21
-
22
-
23
-
24
-
25
-
26
-
27
-
28
-
29
-
30
-
31
-
32
-
33
-
34
-
35
-
36
-
37
-
38
-
39
-
40
-
41
-
42
-
43
-
44
-
45
-
46
-
47
-
48
-
49
-
50
-
51
-
52
-
53
-
54
-
55
-
56
-
57
-
58
-
59
-
60
-
61
-
62
-
63
-
64
-
65
-
66
-
67
-
68
-
69
-
70
-
71
-
72
-
73
-
74
-
75
-
76
-
77
-
78
-
79
-
80
-
81
-
82
-
83
-
84
-
85
-
86
-
87
-
88
-
89
-
90
-
91
-
92
-
93
-
94
-
95
-
96
-
97
-
98
-
99
-
100
-
101
-
102
-
103
-
104
-
105
-
106
-
107
-
108
-
109
-
 110
110 -
 111
111 -
 112
112 -
 113
113 -
 114
114 -
 115
115 -
 116
116 -
 117
117 -
 118
118 -
 119
119 -
 120
120 -
 121
121 -
 122
122 -
 123
123 -
 124
124 -
 125
125 -
 126
126 -
 127
127 -
 128
128 -
 129
129 -
 130
130 -
131
-
132
-
133
-
134
-
135
-
136
-
137
-
138
-
139
-
140
-
141
-
142
-
143
-
144
-
145
-
146
-
147
-
148
-
149
-
150
-
151
-
152
-
153
-
154
-
155
-
156
-
157
-
158
-
159
-
160
-
161
-
162
-
163
-
164
-
165
-
166
-
167
-
168
-
169
-
170
-
171
-
172
-
173
-
174
-
175
-
176
-
177
-
178
-
179
-
180
-
181
-
182
-
183
-
184
-
185
-
186
-
187
-
188
-
189
-
190
-
191
-
192
-
193
-
194
-
195
-
196
-
197
-
198
-
199
-
200
-
201
-
202
-
203
-
204
-
205
-
206
-
207
-
208
-
209
-
210
-
211
-
212
-
213
-
214
-
215
-
216
-
217
-
218
-
219
-
220
-
221
-
222
-
223
-
224
-
225
-
226
-
227
-
228
-
229
-
230
-
231
-
232
-
233
-
234
-
235
-
236
-
237
-
238
-
239
-
240
-
241
-
242
-
243
-
244
-
245
-
246
-
247
-
248
-
249
-
250
-
251
-
252
-
253
-
254
-
255
-
256
-
257
-
258
-
259
-
260
-
261
-
262
-
263
-
264
-
265
-
266
-
267
-
268
-
269
-
270
-
271
-
272
-
273
-
274
-
275
-
276
-
277
-
278
-
279
-
280
-
281
-
282
-
283
-
284
-
285
-
286
-
287
-
288
-
289
-
290
-
291
-
292
-
293
-
294
-
295
-
296
-
297
-
298
-
299
-
300
-
301
-
302
-
303
-
304
-
305
-
306
-
307
-
308
-
309
-
310
-
311
-
312
-
313
-
314
-
315
-
316
-
317
-
318
-
319
-
320
-
321
-
322
-
323
-
324
-
325
-
326
-
327
-
328
-
329
-
330
-
331
-
332
-
333
-
334
-
335
-
336
-
337
-
338
-
339
-
340
-
341
-
342
 |
 |

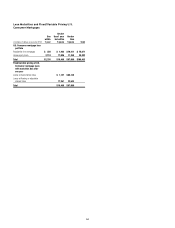
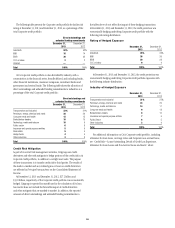
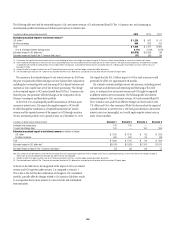
102
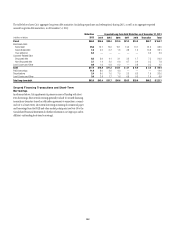
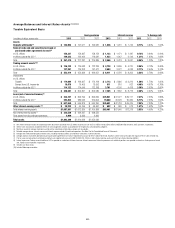
The table below shows Citi’s aggregate long-term debt maturities (including repurchases and redemptions) during 2013, as well as its aggregate expected
annual long-term debt maturities, as of December 31, 2013:
In billions of dollars
Maturities
2013
Expected Long-Term Debt Maturities as of December 31, 2013
2014 2015 2016 2017 2018 Thereafter Total
Parent $46.0 $24.6 $20.4 $21.5 $21.2 $14.3 $62.7 $ 164.7
Benchmark Debt:
Senior debt 25.6 13.7 12.6 16.1 14.5 10.1 31.5 98.5
Subordinated debt 1.0 4.0 0.7 1.5 3.8 1.3 16.8 28.1
Trust preferred 6.4 — — — — — 3.9 3.9
Customer-Related Debt:
Structured debt 8.5 3.6 4.1 3.1 2.2 1.7 7.5 22.2
Non-Structured debt 3.7 1.4 2.2 0.6 0.7 0.4 2.5 7.8
Local Country and Other 0.8 1.9 0.8 0.2 — 0.8 0.5 4.2
Bank $17.8 $18.8 $11.3 $13.1 $ 3.1 $ 6.6 $ 3.5 $ 56.4
FHLB borrowings 11.8 8.0 2.0 4.0 — — — 14.0
Securitizations 2.4 8.0 7.6 7.5 2.3 6.3 1.9 33.6
Local Country and Other 3.6 2.8 1.7 1.6 0.8 0.3 1.6 8.8
Total long-term debt $63.8 $43.4 $31.7 $34.6 $24.3 $20.9 $66.2 $ 221.1
Secured Financing Transactions and Short-Term
Borrowings
As referenced above, Citi supplements its primary sources of funding with short-
term borrowings. Short-term borrowings generally include (i) secured financing
transactions (securities loaned or sold under agreements to repurchase, or repos)
and (ii) to a lesser extent, short-term borrowings consisting of commercial paper
and borrowings from the FHLB and other market participants (see Note 18 to the
Consolidated Financial Statements for further information on Citigroup’s and its
affiliates’ outstanding short-term borrowings).