Citibank 2013 Annual Report Download - page 168
Download and view the complete annual report
Please find page 168 of the 2013 Citibank annual report below. You can navigate through the pages in the report by either clicking on the pages listed below, or by using the keyword search tool below to find specific information within the annual report.-
 1
1 -
2
-
3
-
4
-
5
-
6
-
7
-
8
-
9
-
10
-
11
-
12
-
13
-
14
-
15
-
16
-
17
-
18
-
19
-
20
-
21
-
22
-
23
-
24
-
25
-
26
-
27
-
28
-
29
-
30
-
31
-
32
-
33
-
34
-
35
-
36
-
37
-
38
-
39
-
40
-
41
-
42
-
43
-
44
-
45
-
46
-
47
-
48
-
49
-
50
-
51
-
52
-
53
-
54
-
55
-
56
-
57
-
58
-
59
-
60
-
61
-
62
-
63
-
64
-
65
-
66
-
67
-
68
-
69
-
70
-
71
-
72
-
73
-
74
-
75
-
76
-
77
-
78
-
79
-
80
-
81
-
82
-
83
-
84
-
85
-
86
-
87
-
88
-
89
-
90
-
91
-
92
-
93
-
94
-
95
-
96
-
97
-
98
-
99
-
100
-
101
-
102
-
103
-
104
-
105
-
106
-
107
-
108
-
109
-
110
-
111
-
112
-
113
-
114
-
115
-
116
-
117
-
118
-
119
-
120
-
121
-
122
-
123
-
124
-
125
-
126
-
127
-
128
-
129
-
130
-
131
-
132
-
133
-
134
-
135
-
136
-
137
-
138
-
139
-
140
-
141
-
142
-
143
-
144
-
145
-
146
-
147
-
148
-
149
-
150
-
151
-
152
-
153
-
154
-
155
-
156
-
157
-
 158
158 -
 159
159 -
 160
160 -
 161
161 -
 162
162 -
 163
163 -
 164
164 -
 165
165 -
 166
166 -
 167
167 -
 168
168 -
 169
169 -
 170
170 -
 171
171 -
 172
172 -
 173
173 -
 174
174 -
 175
175 -
 176
176 -
 177
177 -
 178
178 -
179
-
180
-
181
-
182
-
183
-
184
-
185
-
186
-
187
-
188
-
189
-
190
-
191
-
192
-
193
-
194
-
195
-
196
-
197
-
198
-
199
-
200
-
201
-
202
-
203
-
204
-
205
-
206
-
207
-
208
-
209
-
210
-
211
-
212
-
213
-
214
-
215
-
216
-
217
-
218
-
219
-
220
-
221
-
222
-
223
-
224
-
225
-
226
-
227
-
228
-
229
-
230
-
231
-
232
-
233
-
234
-
235
-
236
-
237
-
238
-
239
-
240
-
241
-
242
-
243
-
244
-
245
-
246
-
247
-
248
-
249
-
250
-
251
-
252
-
253
-
254
-
255
-
256
-
257
-
258
-
259
-
260
-
261
-
262
-
263
-
264
-
265
-
266
-
267
-
268
-
269
-
270
-
271
-
272
-
273
-
274
-
275
-
276
-
277
-
278
-
279
-
280
-
281
-
282
-
283
-
284
-
285
-
286
-
287
-
288
-
289
-
290
-
291
-
292
-
293
-
294
-
295
-
296
-
297
-
298
-
299
-
300
-
301
-
302
-
303
-
304
-
305
-
306
-
307
-
308
-
309
-
310
-
311
-
312
-
313
-
314
-
315
-
316
-
317
-
318
-
319
-
320
-
321
-
322
-
323
-
324
-
325
-
326
-
327
-
328
-
329
-
330
-
331
-
332
-
333
-
334
-
335
-
336
-
337
-
338
-
339
-
340
-
341
-
342
 |
 |
150
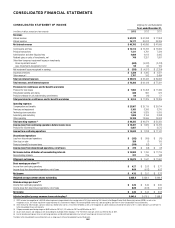
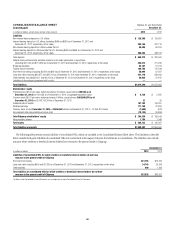
CONSOLIDATED BALANCE SHEET Citigroup Inc. and Subsidiaries
December 31,
In millions of dollars 2013 2012
Assets
Cash and due from banks (including segregated cash and other deposits) $ 29,885 $ 36,453
Deposits with banks 169,005 102,134
Federal funds sold and securities borrowed or purchased under agreements to resell (including $141,481 and
$160,589 as of December 31, 2013 and December 31, 2012, respectively, at fair value) 257,037 261,311
Brokerage receivables 25,674 22,490
Trading account assets (including $106,695 and $105,458 pledged to creditors at December 31, 2013 and December 31, 2012, respectively) 285,928 320,929
Investments (including $26,989 and $21,423 pledged to creditors at December 31, 2013 and December 31, 2012, respectively,
and $291,216 and $294,463 as of December 31, 2013 and December 31, 2012, respectively, at fair value) 308,980 312,326
Loans, net of unearned income
Consumer (including $957 and $1,231 as of December 31, 2013 and December 31, 2012, respectively, at fair value) 393,831 408,671
Corporate (including $4,072 and $4,056 as of December 31, 2013 and December 31, 2012, respectively, at fair value) 271,641 246,793
Loans, net of unearned income $ 665,472 $ 655,464
Allowance for loan losses (19,648) (25,455)
Total loans, net $ 645,824 $ 630,009
Goodwill 25,009 25,673
Intangible assets (other than MSRs) 5,056 5,697
Mortgage servicing rights (MSRs) 2,718 1,942
Other assets (including $7,123 and $13,299 as of December 31, 2013 and December 31, 2012, respectively, at fair value) 125,266 145,660
Assets of discontinued operations held for sale —36
Total assets $1,880,382 $1,864,660
The following table presents certain assets of consolidated variable interest entities (VIEs), which are included in the Consolidated Balance Sheet above. The
assets in the table below include only those assets that can be used to settle obligations of consolidated VIEs on the following page and are in excess of those
obligations. Additionally, the assets in the table below include third-party assets of consolidated VIEs only and exclude intercompany balances that eliminate
in consolidation.
December 31,
In millions of dollars 2013 2012
Assets of consolidated VIEs that can only be used to settle obligations of consolidated VIEs
Cash and due from banks $ 360 $ 498
Trading account assets 977 481
Investments 10,416 10,751
Loans, net of unearned income
Consumer (including $910 and $1,191 as of December 31, 2013 and December 31, 2012, respectively, at fair value) 63,493 93,936
Corporate (including $14 and $157 as of December 31, 2013 and December 31, 2012, respectively, at fair value) 31,919 23,684
Loans, net of unearned income $ 95,412 $117,620
Allowance for loan losses (3,502) (5,854)
Total loans, net $ 91,910 $111,766
Other assets 1,233 674
Total assets of consolidated VIEs that can only be used to settle obligations of consolidated VIEs $104,896 $124,170
Statement continues on the next page.