Citibank 2013 Annual Report Download - page 251
Download and view the complete annual report
Please find page 251 of the 2013 Citibank annual report below. You can navigate through the pages in the report by either clicking on the pages listed below, or by using the keyword search tool below to find specific information within the annual report.-
 1
1 -
2
-
3
-
4
-
5
-
6
-
7
-
8
-
9
-
10
-
11
-
12
-
13
-
14
-
15
-
16
-
17
-
18
-
19
-
20
-
21
-
22
-
23
-
24
-
25
-
26
-
27
-
28
-
29
-
30
-
31
-
32
-
33
-
34
-
35
-
36
-
37
-
38
-
39
-
40
-
41
-
42
-
43
-
44
-
45
-
46
-
47
-
48
-
49
-
50
-
51
-
52
-
53
-
54
-
55
-
56
-
57
-
58
-
59
-
60
-
61
-
62
-
63
-
64
-
65
-
66
-
67
-
68
-
69
-
70
-
71
-
72
-
73
-
74
-
75
-
76
-
77
-
78
-
79
-
80
-
81
-
82
-
83
-
84
-
85
-
86
-
87
-
88
-
89
-
90
-
91
-
92
-
93
-
94
-
95
-
96
-
97
-
98
-
99
-
100
-
101
-
102
-
103
-
104
-
105
-
106
-
107
-
108
-
109
-
110
-
111
-
112
-
113
-
114
-
115
-
116
-
117
-
118
-
119
-
120
-
121
-
122
-
123
-
124
-
125
-
126
-
127
-
128
-
129
-
130
-
131
-
132
-
133
-
134
-
135
-
136
-
137
-
138
-
139
-
140
-
141
-
142
-
143
-
144
-
145
-
146
-
147
-
148
-
149
-
150
-
151
-
152
-
153
-
154
-
155
-
156
-
157
-
158
-
159
-
160
-
161
-
162
-
163
-
164
-
165
-
166
-
167
-
168
-
169
-
170
-
171
-
172
-
173
-
174
-
175
-
176
-
177
-
178
-
179
-
180
-
181
-
182
-
183
-
184
-
185
-
186
-
187
-
188
-
189
-
190
-
191
-
192
-
193
-
194
-
195
-
196
-
197
-
198
-
199
-
200
-
201
-
202
-
203
-
204
-
205
-
206
-
207
-
208
-
209
-
210
-
211
-
212
-
213
-
214
-
215
-
216
-
217
-
218
-
219
-
220
-
221
-
222
-
223
-
224
-
225
-
226
-
227
-
228
-
229
-
230
-
231
-
232
-
233
-
234
-
235
-
236
-
237
-
238
-
239
-
240
-
 241
241 -
 242
242 -
 243
243 -
 244
244 -
 245
245 -
 246
246 -
 247
247 -
 248
248 -
 249
249 -
 250
250 -
 251
251 -
 252
252 -
 253
253 -
 254
254 -
 255
255 -
 256
256 -
 257
257 -
 258
258 -
 259
259 -
 260
260 -
 261
261 -
262
-
263
-
264
-
265
-
266
-
267
-
268
-
269
-
270
-
271
-
272
-
273
-
274
-
275
-
276
-
277
-
278
-
279
-
280
-
281
-
282
-
283
-
284
-
285
-
286
-
287
-
288
-
289
-
290
-
291
-
292
-
293
-
294
-
295
-
296
-
297
-
298
-
299
-
300
-
301
-
302
-
303
-
304
-
305
-
306
-
307
-
308
-
309
-
310
-
311
-
312
-
313
-
314
-
315
-
316
-
317
-
318
-
319
-
320
-
321
-
322
-
323
-
324
-
325
-
326
-
327
-
328
-
329
-
330
-
331
-
332
-
333
-
334
-
335
-
336
-
337
-
338
-
339
-
340
-
341
-
342
 |
 |

233
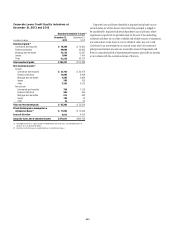
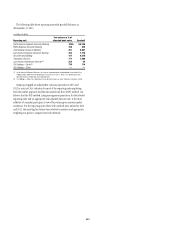
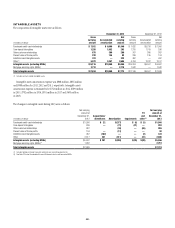
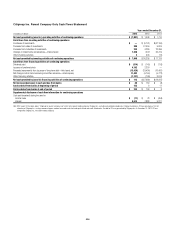
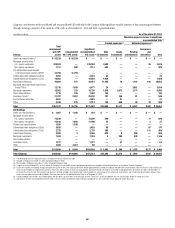
Aggregate annual maturities of long-term debt obligations (based on final maturity dates) including trust preferred securities are as follows:
In millions of dollars 2014 2015 2016 2017 2018 Thereafter Total
Bank $18,823 $11,265 $13,131 $ 3,153 $ 6,630 $ 3,455 $ 56,457
Broker-dealer 2,269 1,332 467 24 1,092 2,671 7,855
Citigroup Inc. 22,332 19,095 20,982 21,159 13,208 60,028 156,804
Total $43,424 $31,692 $34,580 $24,336 $20,930 $66,154 $221,116
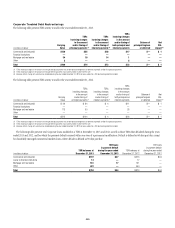
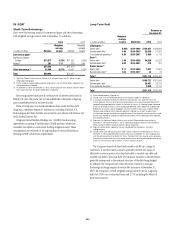
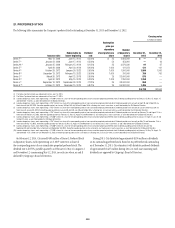
The following table summarizes the Company’s outstanding trust preferred securities at December 31, 2013:
Junior subordinated debentures owned by trust
Trust
Issuance
date
Securities
issued
Liquidation
value (1)
Coupon
rate
Common
shares
issued
to parent Amount Maturity
Redeemable
by issuer
beginning
In millions of dollars, except share amounts
Citigroup Capital III Dec. 1996 194,053 $ 194 7.625% 6,003 $ 200 Dec. 1, 2036 Not redeemable
Citigroup Capital IX Feb. 2003 33,874,813 847 6.000% 1,047,675 873 Feb. 14, 2033 Feb. 13, 2008
Citigroup Capital XI Sept. 2004 18,387,128 460 6.000% 568,675 474 Sept. 27, 2034 Sept. 27, 2009
Citigroup Capital XIII Sept. 2010 89,840,000 2,246 7.875% 1,000 2,246 Oct. 30, 2040 Oct. 30, 2015
Citigroup Capital XVII Mar. 2007 28,047,927 701 6.350% 20,000 702 Mar. 15, 2067 Mar. 15, 2012
Citigroup Capital XVIII Jun. 2007 99,901 165 6.829% 50 165 June 28, 2067 June 28, 2017
Adam Capital Trust III Dec. 2002 17,500 18
3 mo. LIB
+335 bp. 542 18 Jan. 7, 2033 Jan. 7, 2008
Adam Statutory Trust III Dec. 2002 25,000 25
3 mo. LIB
+325 bp. 774 26 Dec. 26, 2032 Dec. 26, 2007
Adam Statutory Trust IV Sept. 2003 40,000 40
3 mo. LIB
+295 bp. 1,238 41 Sept. 17, 2033 Sept. 17, 2008
Adam Statutory Trust V Mar. 2004 35,000 35
3 mo. LIB
+279 bp. 1,083 36 Mar. 17, 2034 Mar. 17, 2009
Total obligated $4,731 $4,781
(1) Represents the notional value received by investors from the trusts at the time of issuance.
In each case, the coupon rate on the subordinated debentures is the same
as that on the trust preferred securities. Distributions on the trust preferred
securities and interest on the subordinated debentures are payable quarterly,
except for Citigroup Capital III and Citigroup Capital XVIII on which
distributions are payable semiannually.