Citibank 2013 Annual Report Download - page 37
Download and view the complete annual report
Please find page 37 of the 2013 Citibank annual report below. You can navigate through the pages in the report by either clicking on the pages listed below, or by using the keyword search tool below to find specific information within the annual report.-
 1
1 -
2
-
3
-
4
-
5
-
6
-
7
-
8
-
9
-
10
-
11
-
12
-
13
-
14
-
15
-
16
-
17
-
18
-
19
-
20
-
21
-
22
-
23
-
24
-
25
-
26
-
 27
27 -
 28
28 -
 29
29 -
 30
30 -
 31
31 -
 32
32 -
 33
33 -
 34
34 -
 35
35 -
 36
36 -
 37
37 -
 38
38 -
 39
39 -
 40
40 -
 41
41 -
 42
42 -
 43
43 -
 44
44 -
 45
45 -
 46
46 -
 47
47 -
48
-
49
-
50
-
51
-
52
-
53
-
54
-
55
-
56
-
57
-
58
-
59
-
60
-
61
-
62
-
63
-
64
-
65
-
66
-
67
-
68
-
69
-
70
-
71
-
72
-
73
-
74
-
75
-
76
-
77
-
78
-
79
-
80
-
81
-
82
-
83
-
84
-
85
-
86
-
87
-
88
-
89
-
90
-
91
-
92
-
93
-
94
-
95
-
96
-
97
-
98
-
99
-
100
-
101
-
102
-
103
-
104
-
105
-
106
-
107
-
108
-
109
-
110
-
111
-
112
-
113
-
114
-
115
-
116
-
117
-
118
-
119
-
120
-
121
-
122
-
123
-
124
-
125
-
126
-
127
-
128
-
129
-
130
-
131
-
132
-
133
-
134
-
135
-
136
-
137
-
138
-
139
-
140
-
141
-
142
-
143
-
144
-
145
-
146
-
147
-
148
-
149
-
150
-
151
-
152
-
153
-
154
-
155
-
156
-
157
-
158
-
159
-
160
-
161
-
162
-
163
-
164
-
165
-
166
-
167
-
168
-
169
-
170
-
171
-
172
-
173
-
174
-
175
-
176
-
177
-
178
-
179
-
180
-
181
-
182
-
183
-
184
-
185
-
186
-
187
-
188
-
189
-
190
-
191
-
192
-
193
-
194
-
195
-
196
-
197
-
198
-
199
-
200
-
201
-
202
-
203
-
204
-
205
-
206
-
207
-
208
-
209
-
210
-
211
-
212
-
213
-
214
-
215
-
216
-
217
-
218
-
219
-
220
-
221
-
222
-
223
-
224
-
225
-
226
-
227
-
228
-
229
-
230
-
231
-
232
-
233
-
234
-
235
-
236
-
237
-
238
-
239
-
240
-
241
-
242
-
243
-
244
-
245
-
246
-
247
-
248
-
249
-
250
-
251
-
252
-
253
-
254
-
255
-
256
-
257
-
258
-
259
-
260
-
261
-
262
-
263
-
264
-
265
-
266
-
267
-
268
-
269
-
270
-
271
-
272
-
273
-
274
-
275
-
276
-
277
-
278
-
279
-
280
-
281
-
282
-
283
-
284
-
285
-
286
-
287
-
288
-
289
-
290
-
291
-
292
-
293
-
294
-
295
-
296
-
297
-
298
-
299
-
300
-
301
-
302
-
303
-
304
-
305
-
306
-
307
-
308
-
309
-
310
-
311
-
312
-
313
-
314
-
315
-
316
-
317
-
318
-
319
-
320
-
321
-
322
-
323
-
324
-
325
-
326
-
327
-
328
-
329
-
330
-
331
-
332
-
333
-
334
-
335
-
336
-
337
-
338
-
339
-
340
-
341
-
342
 |
 |
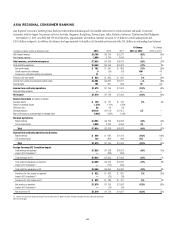
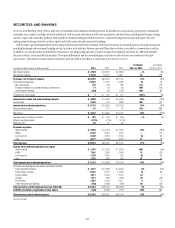
19
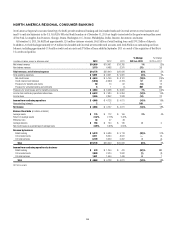
2013 vs. 2012
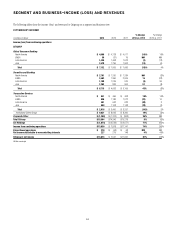
Net income decreased 14%, mainly driven by lower revenues and lower loan
loss reserve releases, partially offset by lower net credit losses and expenses.
Revenues decreased 6% primarily due to lower retail banking revenues.
Retail banking revenues of $5.4 billion declined 20% due to lower mortgage
origination revenues driven by the significantly lower U.S. mortgage
refinancing activity, particularly during the second half of 2013 due to higher
interest rates. In addition, retail banking continued to experience ongoing
spread compression in the deposit portfolios within the consumer and
commercial banking businesses. Partially offsetting the spread compression
was growth in average deposits (8%), average commercial loans (15%)
and average retail loans (3%). While Citi believes mortgage revenues may
have broadly stabilized as of year-end 2013, retail banking revenues will
likely continue to be negatively impacted in 2014 by the lower mortgage
origination revenues and spread compression in the deposit portfolios.
Cards revenues increased 1%. In Citi-branded cards, revenues were
unchanged at $8.2 billion as continued improvement in net interest spreads,
reflecting higher yields as promotional balances represented a smaller
percentage of the portfolio total as well as lower funding costs, were offset
by a 5% decline in average loans. Citi-branded cards net interest revenue
increased 1%, reflecting the higher yields and lower cost of funds, partially
offset by the decline in average loans and a continued increased payment
rate from consumer deleveraging. Citi-branded cards non-interest revenue
declined 5% due to higher affinity rebates.
Citi retail services revenues increased 3% primarily due to the acquisition
of the Best Buy portfolio, partially offset by declining non-interest revenues,
driven by improving credit and the resulting impact on contractual partner
payments. Citi retail services net interest revenues increased 6% driven by a
4% increase in average loans, primarily due to the Best Buy U.S. portfolio
acquisition, although net interest spreads declined as the percentage of
promotional balances within the portfolio increased and could continue to
increase into 2014. Total card purchase sales of $240 billion increased 3%
from the prior year, with 3% growth in Citi-branded cards and 5% growth in
retail services. Citi expects cards revenues could continue to be negatively
impacted by higher payment rates for consumers, reflecting the relatively
slow economic recovery and deleveraging as well as Citi’s shift to higher
credit quality borrowers.
Expenses decreased 3%, primarily due to lower legal and related costs
and repositioning savings, partially offset by higher-mortgage origination
costs in the first half of 2013 and expenses in cards as a result of the Best Buy
portfolio acquisition during the second half of the year.
Provisions increased 7%, as lower net credit losses in the Citi-branded
cards and Citi retail services portfolios were offset by continued lower loan
loss reserve releases ($1.0 billion in 2013 compared to $2.4 billion in 2012),
primarily related to cards, as well as reserve builds for new loans originated
in the Best Buy portfolio during the latter part of 2013, which are expected to
continue into 2014.
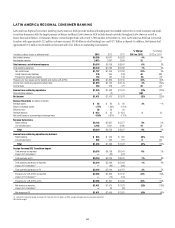
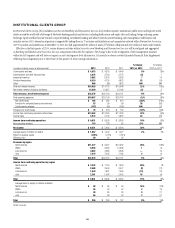
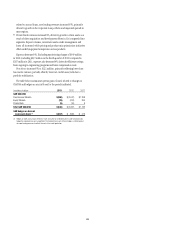
2012 vs. 2011
Net income increased 18%, mainly driven by higher mortgage revenues in
retail banking and a decline in net credit losses, partially offset by a reduction
in loan loss reserve releases.
Revenues increased 5%, driven by a 38% increase in retail banking
mortgage revenues resulting from the high level of U.S. refinancing activity
as well as higher margins resulting from the shift to retail as compared to
third-party origination channels. Excluding mortgages, revenue from the
retail banking business was essentially unchanged, as volume growth and
improved mix in the deposit and lending portfolios within the consumer and
commercial portfolios were offset by significant spread compression.
Cards revenues declined 4%. In Citi-branded cards, both average loans
and net interest revenue declined year-over-year, reflecting continued
increased payment rates resulting from consumer deleveraging and the
impact of the look-back provisions of The Credit Card Accountability
Responsibility and Disclosure Act (CARD Act). In Citi retail services, net
interest revenues improved slightly but were offset by declining non-interest
revenues, driven by improving credit and the resulting impact on contractual
partner payments.
Expenses increased 2%, primarily due to increased mortgage origination
costs resulting from the higher retail channel mortgage volumes and $100
million of repositioning charges in the fourth quarter of 2012 as well as
higher legal and related costs, partially offset by lower expenses in cards.
Provisions decreased 14%, due to a 29% decline in net credit losses,
primarily in the cards portfolios, partly offset by lower loan loss reserve
releases ($2.4 billion in 2012 compared to $4.2 billion in 2011).