Citibank 2013 Annual Report Download - page 128
Download and view the complete annual report
Please find page 128 of the 2013 Citibank annual report below. You can navigate through the pages in the report by either clicking on the pages listed below, or by using the keyword search tool below to find specific information within the annual report.-
 1
1 -
2
-
3
-
4
-
5
-
6
-
7
-
8
-
9
-
10
-
11
-
12
-
13
-
14
-
15
-
16
-
17
-
18
-
19
-
20
-
21
-
22
-
23
-
24
-
25
-
26
-
27
-
28
-
29
-
30
-
31
-
32
-
33
-
34
-
35
-
36
-
37
-
38
-
39
-
40
-
41
-
42
-
43
-
44
-
45
-
46
-
47
-
48
-
49
-
50
-
51
-
52
-
53
-
54
-
55
-
56
-
57
-
58
-
59
-
60
-
61
-
62
-
63
-
64
-
65
-
66
-
67
-
68
-
69
-
70
-
71
-
72
-
73
-
74
-
75
-
76
-
77
-
78
-
79
-
80
-
81
-
82
-
83
-
84
-
85
-
86
-
87
-
88
-
89
-
90
-
91
-
92
-
93
-
94
-
95
-
96
-
97
-
98
-
99
-
100
-
101
-
102
-
103
-
104
-
105
-
106
-
107
-
108
-
109
-
110
-
111
-
112
-
113
-
114
-
115
-
116
-
117
-
 118
118 -
 119
119 -
 120
120 -
 121
121 -
 122
122 -
 123
123 -
 124
124 -
 125
125 -
 126
126 -
 127
127 -
 128
128 -
 129
129 -
 130
130 -
 131
131 -
 132
132 -
 133
133 -
 134
134 -
 135
135 -
 136
136 -
 137
137 -
 138
138 -
139
-
140
-
141
-
142
-
143
-
144
-
145
-
146
-
147
-
148
-
149
-
150
-
151
-
152
-
153
-
154
-
155
-
156
-
157
-
158
-
159
-
160
-
161
-
162
-
163
-
164
-
165
-
166
-
167
-
168
-
169
-
170
-
171
-
172
-
173
-
174
-
175
-
176
-
177
-
178
-
179
-
180
-
181
-
182
-
183
-
184
-
185
-
186
-
187
-
188
-
189
-
190
-
191
-
192
-
193
-
194
-
195
-
196
-
197
-
198
-
199
-
200
-
201
-
202
-
203
-
204
-
205
-
206
-
207
-
208
-
209
-
210
-
211
-
212
-
213
-
214
-
215
-
216
-
217
-
218
-
219
-
220
-
221
-
222
-
223
-
224
-
225
-
226
-
227
-
228
-
229
-
230
-
231
-
232
-
233
-
234
-
235
-
236
-
237
-
238
-
239
-
240
-
241
-
242
-
243
-
244
-
245
-
246
-
247
-
248
-
249
-
250
-
251
-
252
-
253
-
254
-
255
-
256
-
257
-
258
-
259
-
260
-
261
-
262
-
263
-
264
-
265
-
266
-
267
-
268
-
269
-
270
-
271
-
272
-
273
-
274
-
275
-
276
-
277
-
278
-
279
-
280
-
281
-
282
-
283
-
284
-
285
-
286
-
287
-
288
-
289
-
290
-
291
-
292
-
293
-
294
-
295
-
296
-
297
-
298
-
299
-
300
-
301
-
302
-
303
-
304
-
305
-
306
-
307
-
308
-
309
-
310
-
311
-
312
-
313
-
314
-
315
-
316
-
317
-
318
-
319
-
320
-
321
-
322
-
323
-
324
-
325
-
326
-
327
-
328
-
329
-
330
-
331
-
332
-
333
-
334
-
335
-
336
-
337
-
338
-
339
-
340
-
341
-
342
 |
 |
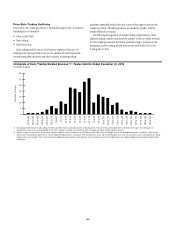
110
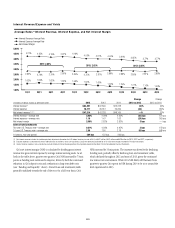
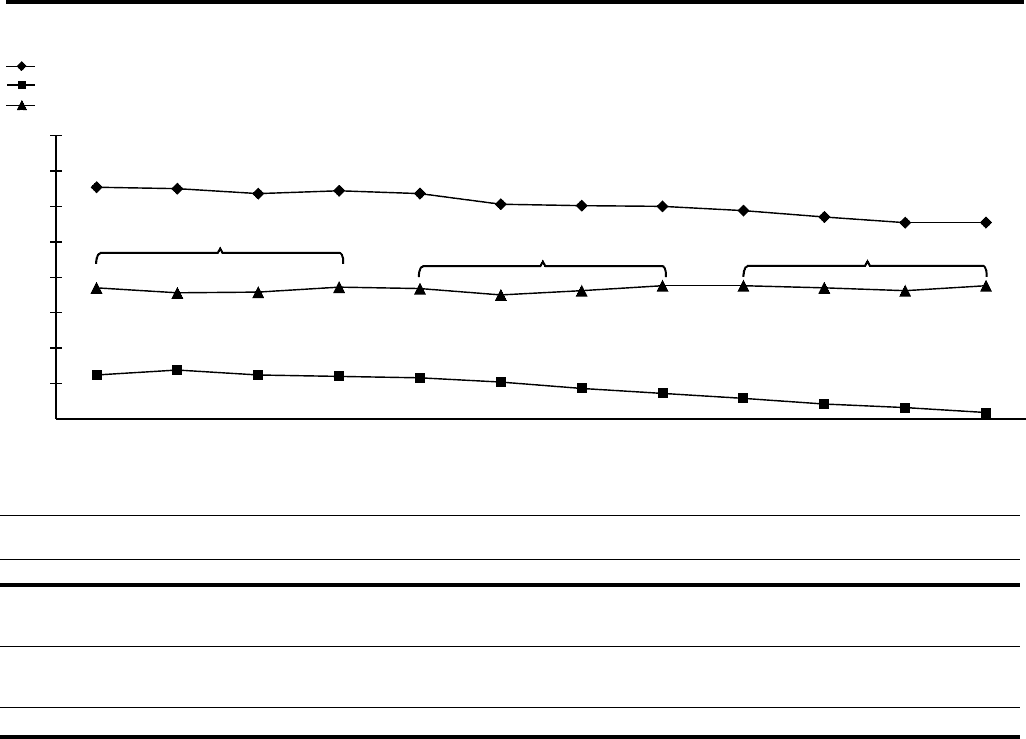
Interest Revenue/Expense and Yields
Average Rates
-
Interest Revenue, Interest Expense, and Net Interest Margin
Interest Revenue-Average Rate
Interest Expense-Average Rate
Net Interest Margin
1.09%
1.16%
1.21%
1.29%
1.36%
1.43%
1.52%
1.58%
1.60%
1.62%
1.69%
1.62%
2.85%
4.27% 4.25% 4.18% 4.22% 4.18% 4.03% 4.01% 4.00% 3.94% 3.85% 3.77% 3.77%
2.78% 2.79% 2.86% 2.84% 2.75% 2.81% 2.88% 2.88% 2.85% 2.81% 2.88%
1Q11 2Q11
2011: 2.82% 2012: 2.82% 2013: 2.85%
3Q11 4Q11 1Q12 2Q12 3Q12 4Q12 1Q13 2Q13 3Q13 4Q13
1.00%
1.50%
2.00%
2.50%
3.00%
3.50%
4.00%
4.50%
5.00%
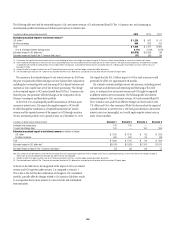
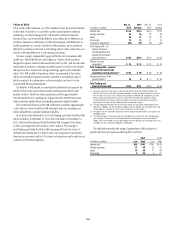
In millions of dollars, except as otherwise noted 2013 2012 2011
Change
2013 vs 2012
Change
2012 vs 2011
Interest revenue (1) $63,491 $67,840 $72,378 (6)% (6)%
Interest expense 16,177 20,612 24,209 (22) (15)%
Net interest revenue (1) (2) 3) $47,314 $47,228 $48,169 —% (2)%
Interest revenue—average rate 3.83% 4.06% 4.23% (23) bps (17) bps
Interest expense—average rate 1.19 1.47 1.63 (28) bps (16) bps
Net interest margin 2.85% 2.82% 2.82% 3 bps — bps
Interest-rate benchmarks
Two-year U.S. Treasury note—average rate 0.31% 0.28% 0.45% 3 bps (17) bps
10-year U.S. Treasury note—average rate 2.35 1.80 2.78 55 bps (98) bps
10-year vs. two-year spread 204 bps 152 bps 233 bps
(1) Net interest revenue includes the taxable equivalent adjustments (based on the U.S. federal statutory tax rate of 35%) of $521 million, $542 million and $520 million for 2013, 2012 and 2011, respectively.
(2) Excludes expenses associated with certain hybrid financial instruments, which are classified as Long-term debt and accounted for at fair value with changes recorded in Principal transactions.
(3) Interest revenue, expense, rates and volumes exclude Credicard (Discontinued operations) for all periods presented. See Note 2 to the Consolidated Financial Statements.
Citi’s net interest margin (NIM) is calculated by dividing gross interest
revenue less gross interest expense by average interest earning assets. As set
forth in the table above, quarter-over-quarter, Citi’s NIM increased by 7 basis
points as funding costs continued to improve, driven by both the continued
reduction in Citi’s deposit costs and a reduction in long-term debt costs
(see “Funding and Liquidity” above). Overall loan and investment yields
generally stabilized towards the end of the year. On a full-year basis, Citi’s
NIM increased by 3 basis points. The increase was driven by the declining
funding costs, partially offset by declining loan and investment yields,
which declined throughout 2012 and most of 2013, given the continued
low interest rate environment. While Citi’s NIM likely will fluctuate from
quarter-to-quarter, Citi expects its NIM during 2014 to be at or around the
level experienced in 2013.