Citibank 2013 Annual Report Download - page 43
Download and view the complete annual report
Please find page 43 of the 2013 Citibank annual report below. You can navigate through the pages in the report by either clicking on the pages listed below, or by using the keyword search tool below to find specific information within the annual report.-
 1
1 -
2
-
3
-
4
-
5
-
6
-
7
-
8
-
9
-
10
-
11
-
12
-
13
-
14
-
15
-
16
-
17
-
18
-
19
-
20
-
21
-
22
-
23
-
24
-
25
-
26
-
27
-
28
-
29
-
30
-
31
-
32
-
 33
33 -
 34
34 -
 35
35 -
 36
36 -
 37
37 -
 38
38 -
 39
39 -
 40
40 -
 41
41 -
 42
42 -
 43
43 -
 44
44 -
 45
45 -
 46
46 -
 47
47 -
 48
48 -
 49
49 -
 50
50 -
 51
51 -
 52
52 -
 53
53 -
54
-
55
-
56
-
57
-
58
-
59
-
60
-
61
-
62
-
63
-
64
-
65
-
66
-
67
-
68
-
69
-
70
-
71
-
72
-
73
-
74
-
75
-
76
-
77
-
78
-
79
-
80
-
81
-
82
-
83
-
84
-
85
-
86
-
87
-
88
-
89
-
90
-
91
-
92
-
93
-
94
-
95
-
96
-
97
-
98
-
99
-
100
-
101
-
102
-
103
-
104
-
105
-
106
-
107
-
108
-
109
-
110
-
111
-
112
-
113
-
114
-
115
-
116
-
117
-
118
-
119
-
120
-
121
-
122
-
123
-
124
-
125
-
126
-
127
-
128
-
129
-
130
-
131
-
132
-
133
-
134
-
135
-
136
-
137
-
138
-
139
-
140
-
141
-
142
-
143
-
144
-
145
-
146
-
147
-
148
-
149
-
150
-
151
-
152
-
153
-
154
-
155
-
156
-
157
-
158
-
159
-
160
-
161
-
162
-
163
-
164
-
165
-
166
-
167
-
168
-
169
-
170
-
171
-
172
-
173
-
174
-
175
-
176
-
177
-
178
-
179
-
180
-
181
-
182
-
183
-
184
-
185
-
186
-
187
-
188
-
189
-
190
-
191
-
192
-
193
-
194
-
195
-
196
-
197
-
198
-
199
-
200
-
201
-
202
-
203
-
204
-
205
-
206
-
207
-
208
-
209
-
210
-
211
-
212
-
213
-
214
-
215
-
216
-
217
-
218
-
219
-
220
-
221
-
222
-
223
-
224
-
225
-
226
-
227
-
228
-
229
-
230
-
231
-
232
-
233
-
234
-
235
-
236
-
237
-
238
-
239
-
240
-
241
-
242
-
243
-
244
-
245
-
246
-
247
-
248
-
249
-
250
-
251
-
252
-
253
-
254
-
255
-
256
-
257
-
258
-
259
-
260
-
261
-
262
-
263
-
264
-
265
-
266
-
267
-
268
-
269
-
270
-
271
-
272
-
273
-
274
-
275
-
276
-
277
-
278
-
279
-
280
-
281
-
282
-
283
-
284
-
285
-
286
-
287
-
288
-
289
-
290
-
291
-
292
-
293
-
294
-
295
-
296
-
297
-
298
-
299
-
300
-
301
-
302
-
303
-
304
-
305
-
306
-
307
-
308
-
309
-
310
-
311
-
312
-
313
-
314
-
315
-
316
-
317
-
318
-
319
-
320
-
321
-
322
-
323
-
324
-
325
-
326
-
327
-
328
-
329
-
330
-
331
-
332
-
333
-
334
-
335
-
336
-
337
-
338
-
339
-
340
-
341
-
342
 |
 |
25
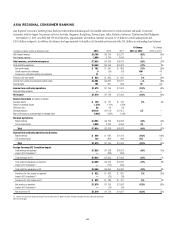
The discussion of the results of operations for Asia RCB below excludes the impact of FX translation for all periods presented. Presentation of the results
of operations, excluding the impact of FX translation, are non-GAAP financial measures. Citi believes the presentation of Asia RCB’s results excluding
the impact of FX translation is a more meaningful depiction of the underlying fundamentals of the business. For a reconciliation of certain of these
metrics to the reported results, see the table above.
2013 vs. 2012
Net income decreased 12%, primarily due to a higher effective tax rate
(see Note 9 to the Consolidated Financial Statements) and lower revenues,
partially offset by lower expenses.
Revenues decreased 1%, as lower net interest revenue was partially offset
by higher non-interest revenue. Net interest revenue declined 5%, primarily
driven by continued spread compression and the repositioning of the
franchise in Korea (see discussion below). Average retail deposits declined
4% resulting from continued efforts to rebalance the deposit portfolio mix.
Average retail loans increased 3% (11% excluding Korea). Non-interest
revenue increased 7%, mainly driven by 22% growth in investment sales
volume, despite a decrease in volumes in the second half of the year due to
investor sentiment, reflecting overall market uncertainty. Cards purchase
sales grew 7%, with growth across the region. Despite lower overall revenues
in 2013, several key markets within the region experienced revenue growth,
including Hong Kong, India, Thailand and China, partially offset by
regulatory changes in the region, particularly Korea as well as Indonesia,
Australia and Taiwan.
Citi expects regulatory changes and spread compression to continue to
have an adverse impact on Asia RCB revenues during 2014. In addition,
consistent with its strategy to concentrate its consumer banking operations
in major metropolitan areas and focus on high quality consumer segments,
Citi is in an ongoing process to reposition its consumer franchise in Korea
to improve its operating efficiency and returns. While revenues in Korea
could begin to stabilize in early 2014, this market could continue to have
a negative impact on year-over-year revenue comparisons for Asia RCB
through 2014.
Expenses declined 3%, as lower repositioning charges and efficiency and
repositioning savings were partially offset by increased investment spending,
particularly investments in China cards.
Provisions increased 5%, reflecting a higher loan loss reserve build due
to volume growth in China, Hong Kong, India and Singapore as well as
regulatory requirements in Korea, partially offset by lower net credit losses.
Despite this increase, overall credit quality in the region remained stable
during the year.
2012 vs. 2011
Net income decreased 5% primarily due to higher expenses.
Revenues were unchanged year-over-year. Net interest revenue decreased
3%, as the benefit of higher loan and deposit balances was offset by spread
compression, mainly in retail lending. Spread compression continued to
reflect improvements in the customer risk profile, stricter underwriting
criteria and the regulatory changes in Korea where policy actions, including
rate caps and other initiatives, were implemented to slow the growth of
consumer credit in that market, thus impacting volume growth, lending
rates and fees. Non-interest revenue increased 6%, reflecting growth in
cards purchase sales, partially offset by a decrease in revenue from foreign
exchange products. Despite the continued spread compression and regulatory
changes in the region, the underlying business metrics continued to grow,
with average retail loans up 6% and average card loans up 2%.
Expenses increased 5%, primarily due to approximately $78 million of
repositioning charges in the fourth quarter of 2012, largely in Korea, and
increased investment spending, including China cards and branches, higher
volume-driven expenses and increased regulatory costs.
Provisions increased 1%, primarily due to lower loan loss reserve
releases, which was partially offset by lower net credit losses. Net credit losses
continued to improve, declining 2% due to the ongoing improvement in
credit quality.