Citibank 2013 Annual Report Download - page 106
Download and view the complete annual report
Please find page 106 of the 2013 Citibank annual report below. You can navigate through the pages in the report by either clicking on the pages listed below, or by using the keyword search tool below to find specific information within the annual report.-
 1
1 -
2
-
3
-
4
-
5
-
6
-
7
-
8
-
9
-
10
-
11
-
12
-
13
-
14
-
15
-
16
-
17
-
18
-
19
-
20
-
21
-
22
-
23
-
24
-
25
-
26
-
27
-
28
-
29
-
30
-
31
-
32
-
33
-
34
-
35
-
36
-
37
-
38
-
39
-
40
-
41
-
42
-
43
-
44
-
45
-
46
-
47
-
48
-
49
-
50
-
51
-
52
-
53
-
54
-
55
-
56
-
57
-
58
-
59
-
60
-
61
-
62
-
63
-
64
-
65
-
66
-
67
-
68
-
69
-
70
-
71
-
72
-
73
-
74
-
75
-
76
-
77
-
78
-
79
-
80
-
81
-
82
-
83
-
84
-
85
-
86
-
87
-
88
-
89
-
90
-
91
-
92
-
93
-
94
-
95
-
 96
96 -
 97
97 -
 98
98 -
 99
99 -
 100
100 -
 101
101 -
 102
102 -
 103
103 -
 104
104 -
 105
105 -
 106
106 -
 107
107 -
 108
108 -
 109
109 -
 110
110 -
 111
111 -
 112
112 -
 113
113 -
 114
114 -
 115
115 -
 116
116 -
117
-
118
-
119
-
120
-
121
-
122
-
123
-
124
-
125
-
126
-
127
-
128
-
129
-
130
-
131
-
132
-
133
-
134
-
135
-
136
-
137
-
138
-
139
-
140
-
141
-
142
-
143
-
144
-
145
-
146
-
147
-
148
-
149
-
150
-
151
-
152
-
153
-
154
-
155
-
156
-
157
-
158
-
159
-
160
-
161
-
162
-
163
-
164
-
165
-
166
-
167
-
168
-
169
-
170
-
171
-
172
-
173
-
174
-
175
-
176
-
177
-
178
-
179
-
180
-
181
-
182
-
183
-
184
-
185
-
186
-
187
-
188
-
189
-
190
-
191
-
192
-
193
-
194
-
195
-
196
-
197
-
198
-
199
-
200
-
201
-
202
-
203
-
204
-
205
-
206
-
207
-
208
-
209
-
210
-
211
-
212
-
213
-
214
-
215
-
216
-
217
-
218
-
219
-
220
-
221
-
222
-
223
-
224
-
225
-
226
-
227
-
228
-
229
-
230
-
231
-
232
-
233
-
234
-
235
-
236
-
237
-
238
-
239
-
240
-
241
-
242
-
243
-
244
-
245
-
246
-
247
-
248
-
249
-
250
-
251
-
252
-
253
-
254
-
255
-
256
-
257
-
258
-
259
-
260
-
261
-
262
-
263
-
264
-
265
-
266
-
267
-
268
-
269
-
270
-
271
-
272
-
273
-
274
-
275
-
276
-
277
-
278
-
279
-
280
-
281
-
282
-
283
-
284
-
285
-
286
-
287
-
288
-
289
-
290
-
291
-
292
-
293
-
294
-
295
-
296
-
297
-
298
-
299
-
300
-
301
-
302
-
303
-
304
-
305
-
306
-
307
-
308
-
309
-
310
-
311
-
312
-
313
-
314
-
315
-
316
-
317
-
318
-
319
-
320
-
321
-
322
-
323
-
324
-
325
-
326
-
327
-
328
-
329
-
330
-
331
-
332
-
333
-
334
-
335
-
336
-
337
-
338
-
339
-
340
-
341
-
342
 |
 |

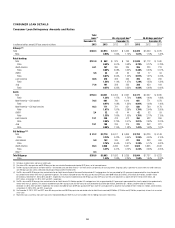
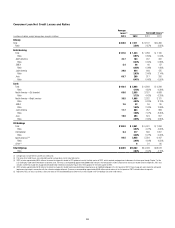
88
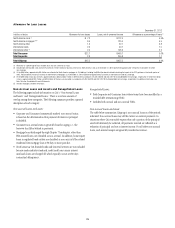
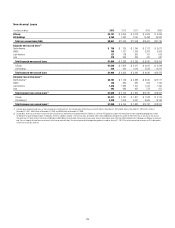
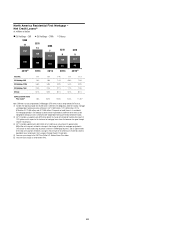
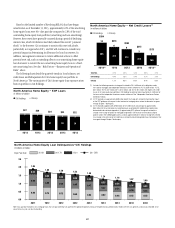
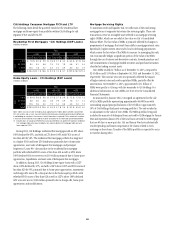
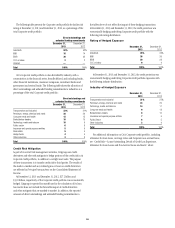
As evidenced by the tables above, home equity loan net credit losses
and delinquencies improved during 2013, including fewer loans entering
the 30-89 days past due delinquency bucket, primarily due to continued
modifications and liquidations. Given the lack of a market in which to sell
delinquent home equity loans, as well as the relatively smaller number of
home equity loan modifications and modification programs (see Note 15 to
the Consolidated Financial Statements), Citi’s ability to reduce delinquencies
or net credit losses in its home equity loan portfolio in Citi Holdings, whether
pursuant to deterioration of the underlying credit performance of these loans
or otherwise, is more limited as compared to residential first mortgages.
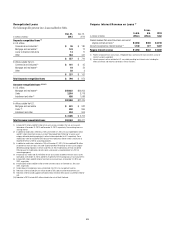
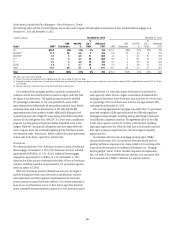
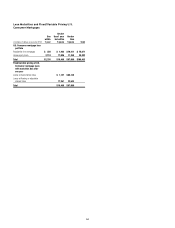
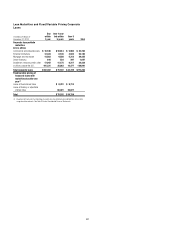
North America Home Equity Loans—State Delinquency Trends
The following tables set forth, for total Citigroup, the six states and/or regions with the highest concentration of Citi’s home equity loans as of
December 31, 2013 and December 31, 2012.
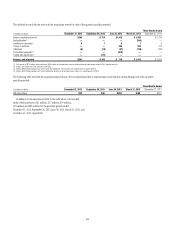
In billions of dollars December 31, 2013 December 31, 20112
State (1) ENR (2)
ENR
Distribution
90+DPD
%
%
CLTV >
100% (3)
Refreshed
FICO ENR (2)
ENR
Distribution
90+DPD
%
%
CLTV >
100% (3)
Refreshed
FICO
CA $ 8.2 28% 1.6% 17% 726 $ 9.7 28% 2.0% 40% 723
NY/NJ/CT (4) 7.2 24 2.3 12 718 8.2 23 2.3 20 715
FL (4) 2.1 7 2.9 44 704 2.4 7 3.4 58 698
IL (4) 1.2 4 1.6 42 713 1.4 4 2.1 55 708
IN/OH/MI (4) 1.0 3 1.6 47 686 1.2 3 2.2 55 679
AZ/NV 0.7 2 2.1 53 713 0.8 2 3.1 70 709
Other 9.5 32 1.7 26 699 11.5 33 2.2 37 695
Total $29.9 100% 1.9% 23% 712 $35.2 100% 2.3% 37% 704
Note: Totals may not sum due to rounding.
(1) Certain of the states are included as part of a region based on Citi’s view of similar HPI within the region.
(2) Ending net receivables. Excludes loans in Canada and Puerto Rico and loans subject to LTSCs. Excludes balances for which FICO or LTV data are unavailable.
(3) Represents combined loan-to-value (CLTV) for both residential first mortgages and home equity loans.
(4) New York, New Jersey, Connecticut, Indiana, Ohio, Florida and Illinois are judicial states.
Citi’s home equity portfolio is primarily concentrated in California and
the New York/New Jersey/Connecticut region (with New York the largest of
the three states). The significant improvement in refreshed CLTV percentages
as of December 31, 2013 were primarily the result of improvements in HPI
in these states/regions, thereby increasing values used in the determination
of CLTV.
National Mortgage Settlement
Under the national mortgage settlement, entered into by Citi and other
financial institutions in February 2012, Citi agreed to provide customer
relief in the form of loan modifications for delinquent borrowers, including
principal reductions, and other loss mitigation activities, and refinancing
concessions to enable current borrowers whose properties are worth less
than the balance of their loans to reduce their interest rates. Citi believes
it has fulfilled its requirement for the loan modification remediation and
refinancing concessions under the settlement. The results are pending review
and certification of the monitor required by the settlement, which is not
expected to be completed until the first half of 2014.
Independent Foreclosure Review Settlement
As of December 31, 2013, Citi continues to fulfill its mortgage assistance
obligations under the independent foreclosure review settlement, entered into
by Citi and other major mortgage servicers in January 2013, and estimates
it will incur additional net credit losses of approximately $25 million per
quarter through the first half of 2014. Citi continues to believe its loan loss
reserve as of December 31, 2013 will be sufficient to cover any mortgage
assistance under the settlement.