Citibank 2013 Annual Report Download - page 262
Download and view the complete annual report
Please find page 262 of the 2013 Citibank annual report below. You can navigate through the pages in the report by either clicking on the pages listed below, or by using the keyword search tool below to find specific information within the annual report.-
 1
1 -
2
-
3
-
4
-
5
-
6
-
7
-
8
-
9
-
10
-
11
-
12
-
13
-
14
-
15
-
16
-
17
-
18
-
19
-
20
-
21
-
22
-
23
-
24
-
25
-
26
-
27
-
28
-
29
-
30
-
31
-
32
-
33
-
34
-
35
-
36
-
37
-
38
-
39
-
40
-
41
-
42
-
43
-
44
-
45
-
46
-
47
-
48
-
49
-
50
-
51
-
52
-
53
-
54
-
55
-
56
-
57
-
58
-
59
-
60
-
61
-
62
-
63
-
64
-
65
-
66
-
67
-
68
-
69
-
70
-
71
-
72
-
73
-
74
-
75
-
76
-
77
-
78
-
79
-
80
-
81
-
82
-
83
-
84
-
85
-
86
-
87
-
88
-
89
-
90
-
91
-
92
-
93
-
94
-
95
-
96
-
97
-
98
-
99
-
100
-
101
-
102
-
103
-
104
-
105
-
106
-
107
-
108
-
109
-
110
-
111
-
112
-
113
-
114
-
115
-
116
-
117
-
118
-
119
-
120
-
121
-
122
-
123
-
124
-
125
-
126
-
127
-
128
-
129
-
130
-
131
-
132
-
133
-
134
-
135
-
136
-
137
-
138
-
139
-
140
-
141
-
142
-
143
-
144
-
145
-
146
-
147
-
148
-
149
-
150
-
151
-
152
-
153
-
154
-
155
-
156
-
157
-
158
-
159
-
160
-
161
-
162
-
163
-
164
-
165
-
166
-
167
-
168
-
169
-
170
-
171
-
172
-
173
-
174
-
175
-
176
-
177
-
178
-
179
-
180
-
181
-
182
-
183
-
184
-
185
-
186
-
187
-
188
-
189
-
190
-
191
-
192
-
193
-
194
-
195
-
196
-
197
-
198
-
199
-
200
-
201
-
202
-
203
-
204
-
205
-
206
-
207
-
208
-
209
-
210
-
211
-
212
-
213
-
214
-
215
-
216
-
217
-
218
-
219
-
220
-
221
-
222
-
223
-
224
-
225
-
226
-
227
-
228
-
229
-
230
-
231
-
232
-
233
-
234
-
235
-
236
-
237
-
238
-
239
-
240
-
241
-
242
-
243
-
244
-
245
-
246
-
247
-
248
-
249
-
250
-
251
-
 252
252 -
 253
253 -
 254
254 -
 255
255 -
 256
256 -
 257
257 -
 258
258 -
 259
259 -
 260
260 -
 261
261 -
 262
262 -
 263
263 -
 264
264 -
 265
265 -
 266
266 -
 267
267 -
 268
268 -
 269
269 -
 270
270 -
 271
271 -
 272
272 -
273
-
274
-
275
-
276
-
277
-
278
-
279
-
280
-
281
-
282
-
283
-
284
-
285
-
286
-
287
-
288
-
289
-
290
-
291
-
292
-
293
-
294
-
295
-
296
-
297
-
298
-
299
-
300
-
301
-
302
-
303
-
304
-
305
-
306
-
307
-
308
-
309
-
310
-
311
-
312
-
313
-
314
-
315
-
316
-
317
-
318
-
319
-
320
-
321
-
322
-
323
-
324
-
325
-
326
-
327
-
328
-
329
-
330
-
331
-
332
-
333
-
334
-
335
-
336
-
337
-
338
-
339
-
340
-
341
-
342
 |
 |

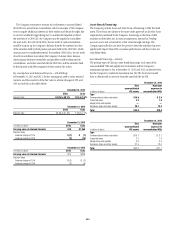
244
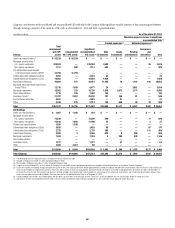
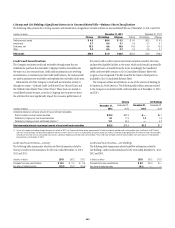
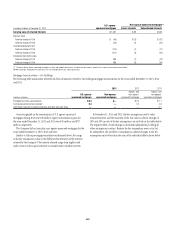
Funding Commitments for Significant Unconsolidated VIEs—Liquidity Facilities and Loan Commitments
The following table presents the notional amount of liquidity facilities and loan commitments that are classified as funding commitments in the VIE tables
above as of December 31, 2013 and 2012:
December 31, 2013 December 31, 2012
In millions of dollars Liquidity facilities Loan commitments Liquidity facilities Loan commitments
Citicorp
Citi-administered asset-backed commercial paper conduits (ABCP) $ — $ — $ 7,615 $ —
Asset-based financing 5 1,127 6 2,075
Municipal securities tender option bond trusts (TOBs) 3,881 — 4,628 —
Municipal investments — 1,173 — 1,669
Investment funds — 81 — —
Other — 20 — 22
Total Citicorp $3,886 $2,401 $12,249 $3,766
Citi Holdings
Collateralized loan obligations (CLOs) $ — $ — $ 13 $ —
Asset-based financing — 258 — 243
Municipal investments — 939 — 992
Total Citi Holdings $ — $ 1,197 $ 13 $1,235
Total Citigroup funding commitments $3,886 $3,598 $12,262 $5,001
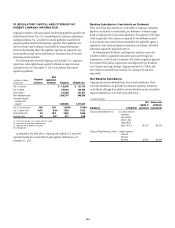
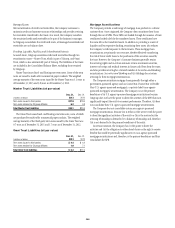
Citicorp and Citi Holdings Consolidated VIEs
The Company engages in on-balance-sheet securitizations, which are
securitizations that do not qualify for sales treatment; thus, the assets remain
on the Company’s balance sheet. The consolidated VIEs included in the
tables below represent hundreds of separate entities with which the Company
is involved. In general, the third-party investors in the obligations of
consolidated VIEs have legal recourse only to the assets of the VIEs and do not
have such recourse to the Company, except where the Company has provided
a guarantee to the investors or is the counterparty to certain derivative
transactions involving the VIE. In addition, the assets are generally restricted
only to pay such liabilities.
Thus, the Company’s maximum legal exposure to loss related to
consolidated VIEs is significantly less than the carrying value of the
consolidated VIE assets due to outstanding third-party financing.
Intercompany assets and liabilities are excluded from the table. All assets are
restricted from being sold or pledged as collateral. The cash flows from these
assets are the only source used to pay down the associated liabilities, which
are non-recourse to the Company’s general assets.
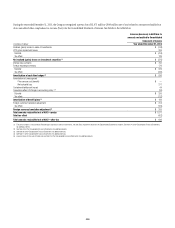
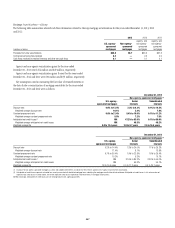
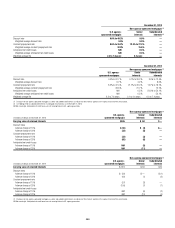
The following table presents the carrying amounts and classifications
of consolidated assets that are collateral for consolidated VIE and SPE
obligations as of December 31, 2013 and 2012:
In billions of dollars December 31, 2013 December 31, 2012
Citicorp Citi Holdings Citigroup Citicorp Citi Holdings Citigroup
Cash $ 0.2 $ 0.2 $ 0.4 $ 0.3 $ 0.2 $ 0.5
Trading account assets 1.0 — 1.0 0.5 — 0.5
Investments 10.4 — 10.4 10.7 — 10.7
Total loans, net 83.2 8.7 91.9 100.8 11.0 111.8
Other 1.1 0.2 1.3 0.5 0.2 0.7
Total assets $95.9 $ 9.1 $ 105.0 $ 112.8 $11.4 $ 124.2
Short-term borrowings $24.3 $ — $ 24.3 $ 17.9 $ — $ 17.9
Long-term debt 32.8 2.0 34.8 23.8 2.6 26.4
Other liabilities 0.9 0.1 1.0 1.1 0.1 1.2
Total liabilities $58.0 $ 2.1 $ 60.1 $ 42.8 $ 2.7 $ 45.5