Citibank 2013 Annual Report Download - page 244
Download and view the complete annual report
Please find page 244 of the 2013 Citibank annual report below. You can navigate through the pages in the report by either clicking on the pages listed below, or by using the keyword search tool below to find specific information within the annual report.-
 1
1 -
2
-
3
-
4
-
5
-
6
-
7
-
8
-
9
-
10
-
11
-
12
-
13
-
14
-
15
-
16
-
17
-
18
-
19
-
20
-
21
-
22
-
23
-
24
-
25
-
26
-
27
-
28
-
29
-
30
-
31
-
32
-
33
-
34
-
35
-
36
-
37
-
38
-
39
-
40
-
41
-
42
-
43
-
44
-
45
-
46
-
47
-
48
-
49
-
50
-
51
-
52
-
53
-
54
-
55
-
56
-
57
-
58
-
59
-
60
-
61
-
62
-
63
-
64
-
65
-
66
-
67
-
68
-
69
-
70
-
71
-
72
-
73
-
74
-
75
-
76
-
77
-
78
-
79
-
80
-
81
-
82
-
83
-
84
-
85
-
86
-
87
-
88
-
89
-
90
-
91
-
92
-
93
-
94
-
95
-
96
-
97
-
98
-
99
-
100
-
101
-
102
-
103
-
104
-
105
-
106
-
107
-
108
-
109
-
110
-
111
-
112
-
113
-
114
-
115
-
116
-
117
-
118
-
119
-
120
-
121
-
122
-
123
-
124
-
125
-
126
-
127
-
128
-
129
-
130
-
131
-
132
-
133
-
134
-
135
-
136
-
137
-
138
-
139
-
140
-
141
-
142
-
143
-
144
-
145
-
146
-
147
-
148
-
149
-
150
-
151
-
152
-
153
-
154
-
155
-
156
-
157
-
158
-
159
-
160
-
161
-
162
-
163
-
164
-
165
-
166
-
167
-
168
-
169
-
170
-
171
-
172
-
173
-
174
-
175
-
176
-
177
-
178
-
179
-
180
-
181
-
182
-
183
-
184
-
185
-
186
-
187
-
188
-
189
-
190
-
191
-
192
-
193
-
194
-
195
-
196
-
197
-
198
-
199
-
200
-
201
-
202
-
203
-
204
-
205
-
206
-
207
-
208
-
209
-
210
-
211
-
212
-
213
-
214
-
215
-
216
-
217
-
218
-
219
-
220
-
221
-
222
-
223
-
224
-
225
-
226
-
227
-
228
-
229
-
230
-
231
-
232
-
233
-
 234
234 -
 235
235 -
 236
236 -
 237
237 -
 238
238 -
 239
239 -
 240
240 -
 241
241 -
 242
242 -
 243
243 -
 244
244 -
 245
245 -
 246
246 -
 247
247 -
 248
248 -
 249
249 -
 250
250 -
 251
251 -
 252
252 -
 253
253 -
 254
254 -
255
-
256
-
257
-
258
-
259
-
260
-
261
-
262
-
263
-
264
-
265
-
266
-
267
-
268
-
269
-
270
-
271
-
272
-
273
-
274
-
275
-
276
-
277
-
278
-
279
-
280
-
281
-
282
-
283
-
284
-
285
-
286
-
287
-
288
-
289
-
290
-
291
-
292
-
293
-
294
-
295
-
296
-
297
-
298
-
299
-
300
-
301
-
302
-
303
-
304
-
305
-
306
-
307
-
308
-
309
-
310
-
311
-
312
-
313
-
314
-
315
-
316
-
317
-
318
-
319
-
320
-
321
-
322
-
323
-
324
-
325
-
326
-
327
-
328
-
329
-
330
-
331
-
332
-
333
-
334
-
335
-
336
-
337
-
338
-
339
-
340
-
341
-
342
 |
 |

226
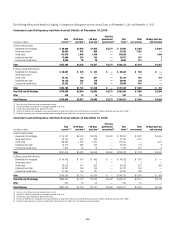
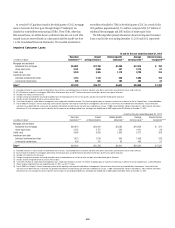
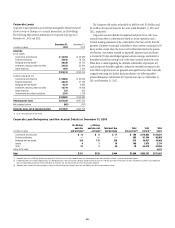
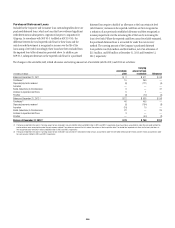
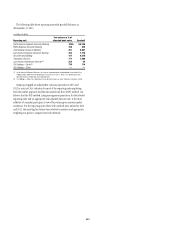
Purchased Distressed Loans
Included in the Corporate and Consumer loan outstanding tables above are
purchased distressed loans, which are loans that have evidenced significant
credit deterioration subsequent to origination but prior to acquisition by
Citigroup. In accordance with SOP 03-3 (codified as ASC 310-30), the
difference between the total expected cash flows for these loans and the
initial recorded investment is recognized in income over the life of the
loans using a level yield. Accordingly, these loans have been excluded from
the impaired loan table information presented above. In addition, per
SOP 03-3, subsequent decreases in the expected cash flows for a purchased
distressed loan require a build of an allowance so the loan retains its level
yield. However, increases in the expected cash flows are first recognized as
a reduction of any previously established allowance and then recognized as
income prospectively over the remaining life of the loan by increasing the
loan’s level yield. Where the expected cash flows cannot be reliably estimated,
the purchased distressed loan is accounted for under the cost recovery
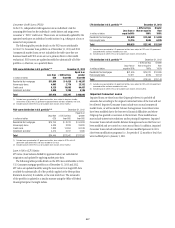
method. The carrying amount of the Company’s purchased distressed
loan portfolio was $636 million and $440 million, net of an allowance of
$113 million, and $98 million at December 31, 2013 and December 31,
2012, respectively.
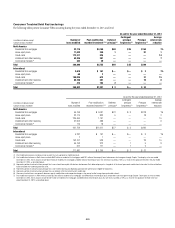
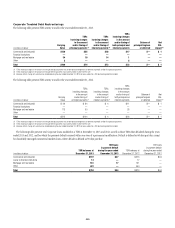
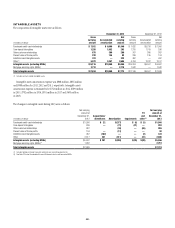
The changes in the accretable yield, related allowance and carrying amount net of accretable yield for 2013 and 2012 are as follows:
In millions of dollars
Accretable
yield
Carrying
amount of loan
receivable Allowance
Balance at December 31, 2011 $ 2 $ 511 $ 68
Purchases (1) 15 269 —
Disposals/payments received (6) (171) (6)
Accretion — — —
Builds (reductions) to the allowance 9 — 41
Increase to expected cash flows 5 1 —
FX/other (3) (72) (5)
Balance at December 31, 2012 (2) $ 22 $ 538 $ 98
Purchases (1) 46 405 —
Disposals/payments received (5) (154) (8)
Accretion (10) 10 —
Builds (reductions) to the allowance 22 — 25
Increase to expected cash flows 3 — —
FX/other — (50) (2)
Balance at December 31, 2013 (2) $ 78 $ 749 $113
(1) The balance reported in the column “Carrying amount of loan receivable” consists of $405 million and $269 million in 2013 and 2012, respectively, of purchased loans accounted for under the level-yield method. No
purchased loans were accounted for under the cost-recovery method. These balances represent the fair value of these loans at their acquisition date. The related total expected cash flows for the level-yield loans at
their acquisition dates were $451 million and $285 million in 2013 and 2012, respectively.
(2) The balance reported in the column “Carrying amount of loan receivable” consists of $737 million $524 million of loans accounted for under the level-yield method and $12 million and $14 million accounted for under
the cost-recovery method in 2013 and 2012, respectively.