Citibank 2013 Annual Report Download - page 254
Download and view the complete annual report
Please find page 254 of the 2013 Citibank annual report below. You can navigate through the pages in the report by either clicking on the pages listed below, or by using the keyword search tool below to find specific information within the annual report.-
 1
1 -
2
-
3
-
4
-
5
-
6
-
7
-
8
-
9
-
10
-
11
-
12
-
13
-
14
-
15
-
16
-
17
-
18
-
19
-
20
-
21
-
22
-
23
-
24
-
25
-
26
-
27
-
28
-
29
-
30
-
31
-
32
-
33
-
34
-
35
-
36
-
37
-
38
-
39
-
40
-
41
-
42
-
43
-
44
-
45
-
46
-
47
-
48
-
49
-
50
-
51
-
52
-
53
-
54
-
55
-
56
-
57
-
58
-
59
-
60
-
61
-
62
-
63
-
64
-
65
-
66
-
67
-
68
-
69
-
70
-
71
-
72
-
73
-
74
-
75
-
76
-
77
-
78
-
79
-
80
-
81
-
82
-
83
-
84
-
85
-
86
-
87
-
88
-
89
-
90
-
91
-
92
-
93
-
94
-
95
-
96
-
97
-
98
-
99
-
100
-
101
-
102
-
103
-
104
-
105
-
106
-
107
-
108
-
109
-
110
-
111
-
112
-
113
-
114
-
115
-
116
-
117
-
118
-
119
-
120
-
121
-
122
-
123
-
124
-
125
-
126
-
127
-
128
-
129
-
130
-
131
-
132
-
133
-
134
-
135
-
136
-
137
-
138
-
139
-
140
-
141
-
142
-
143
-
144
-
145
-
146
-
147
-
148
-
149
-
150
-
151
-
152
-
153
-
154
-
155
-
156
-
157
-
158
-
159
-
160
-
161
-
162
-
163
-
164
-
165
-
166
-
167
-
168
-
169
-
170
-
171
-
172
-
173
-
174
-
175
-
176
-
177
-
178
-
179
-
180
-
181
-
182
-
183
-
184
-
185
-
186
-
187
-
188
-
189
-
190
-
191
-
192
-
193
-
194
-
195
-
196
-
197
-
198
-
199
-
200
-
201
-
202
-
203
-
204
-
205
-
206
-
207
-
208
-
209
-
210
-
211
-
212
-
213
-
214
-
215
-
216
-
217
-
218
-
219
-
220
-
221
-
222
-
223
-
224
-
225
-
226
-
227
-
228
-
229
-
230
-
231
-
232
-
233
-
234
-
235
-
236
-
237
-
238
-
239
-
240
-
241
-
242
-
243
-
 244
244 -
 245
245 -
 246
246 -
 247
247 -
 248
248 -
 249
249 -
 250
250 -
 251
251 -
 252
252 -
 253
253 -
 254
254 -
 255
255 -
 256
256 -
 257
257 -
 258
258 -
 259
259 -
 260
260 -
 261
261 -
 262
262 -
 263
263 -
 264
264 -
265
-
266
-
267
-
268
-
269
-
270
-
271
-
272
-
273
-
274
-
275
-
276
-
277
-
278
-
279
-
280
-
281
-
282
-
283
-
284
-
285
-
286
-
287
-
288
-
289
-
290
-
291
-
292
-
293
-
294
-
295
-
296
-
297
-
298
-
299
-
300
-
301
-
302
-
303
-
304
-
305
-
306
-
307
-
308
-
309
-
310
-
311
-
312
-
313
-
314
-
315
-
316
-
317
-
318
-
319
-
320
-
321
-
322
-
323
-
324
-
325
-
326
-
327
-
328
-
329
-
330
-
331
-
332
-
333
-
334
-
335
-
336
-
337
-
338
-
339
-
340
-
341
-
342
 |
 |

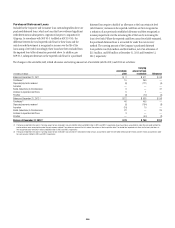
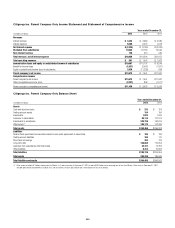
236
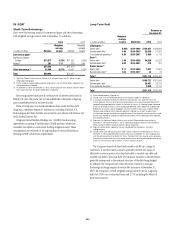
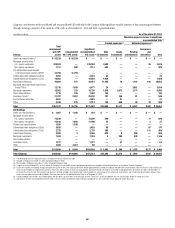
Citigroup Inc. Parent Company Only Cash Flows Statement
Years ended December 31,
In millions of dollars 2013 2012 2011
Net cash provided by (used in ) operating activities of continuing operations $ (7,881) $1,598 $ 1,710
Cash flows from investing activities of continuing operations
Purchases of investments $ — $ (5,701) $(47,190)
Proceeds from sales of investments 385 37,056 9,524
Proceeds from maturities of investments 233 4,286 22,386
Changes in investments and advances—intercompany 7,226 (397) 32,419
Other investing activities 4994 (10)
Net cash provided by investing activities of continuing operations $ 7,848 $ 36,238 $ 17,129
Cash flows from financing activities of continuing operations
Dividends paid $ (314) $ (143) $ (113)
Issuance of preferred stock 4,192 2,250 —
Proceeds (repayments) from issuance of long-term debt—third-party, net (13,426) (33,434) (16,481)
Net change in short-term borrowings and other advances—intercompany 11,402 (6,160) (5,772)
Other financing activities (1,741) (199) 3,519
Net cash provided by (used in) financing activities of continuing operations $ 113 $(37,686) $(18,847)
Net increase (decrease) in cash and due from banks $ 80 $ 150 $ (8)
Cash and due from banks at beginning of period 153 3 11
Cash and due from banks at end of period $ 233 $ 153 $ 3
Supplemental disclosure of cash flow information for continuing operations
Cash paid (received) during the year for
Income taxes $ (71) $ 78 $ (458)
Interest 6,514 7,883 9,271
Note: With respect to the tables above, “Citigroup Inc. parent company only” refers to the parent holding company Citigroup Inc., excluding consolidated subsidiaries. Citigroup Funding Inc. (CFI) was previously a first-tier
subsidiary of Citigroup Inc., issuing commercial paper, medium-term notes and structured equity-linked and credit-linked notes. The debt of CFI was guaranteed by Citigroup Inc. On December 31, 2012, CFI was
merged into Citigroup Inc., the parent holding company.