Citibank 2013 Annual Report Download - page 153
Download and view the complete annual report
Please find page 153 of the 2013 Citibank annual report below. You can navigate through the pages in the report by either clicking on the pages listed below, or by using the keyword search tool below to find specific information within the annual report.-
 1
1 -
2
-
3
-
4
-
5
-
6
-
7
-
8
-
9
-
10
-
11
-
12
-
13
-
14
-
15
-
16
-
17
-
18
-
19
-
20
-
21
-
22
-
23
-
24
-
25
-
26
-
27
-
28
-
29
-
30
-
31
-
32
-
33
-
34
-
35
-
36
-
37
-
38
-
39
-
40
-
41
-
42
-
43
-
44
-
45
-
46
-
47
-
48
-
49
-
50
-
51
-
52
-
53
-
54
-
55
-
56
-
57
-
58
-
59
-
60
-
61
-
62
-
63
-
64
-
65
-
66
-
67
-
68
-
69
-
70
-
71
-
72
-
73
-
74
-
75
-
76
-
77
-
78
-
79
-
80
-
81
-
82
-
83
-
84
-
85
-
86
-
87
-
88
-
89
-
90
-
91
-
92
-
93
-
94
-
95
-
96
-
97
-
98
-
99
-
100
-
101
-
102
-
103
-
104
-
105
-
106
-
107
-
108
-
109
-
110
-
111
-
112
-
113
-
114
-
115
-
116
-
117
-
118
-
119
-
120
-
121
-
122
-
123
-
124
-
125
-
126
-
127
-
128
-
129
-
130
-
131
-
132
-
133
-
134
-
135
-
136
-
137
-
138
-
139
-
140
-
141
-
142
-
 143
143 -
 144
144 -
 145
145 -
 146
146 -
 147
147 -
 148
148 -
 149
149 -
 150
150 -
 151
151 -
 152
152 -
 153
153 -
 154
154 -
 155
155 -
 156
156 -
 157
157 -
 158
158 -
 159
159 -
 160
160 -
 161
161 -
 162
162 -
 163
163 -
164
-
165
-
166
-
167
-
168
-
169
-
170
-
171
-
172
-
173
-
174
-
175
-
176
-
177
-
178
-
179
-
180
-
181
-
182
-
183
-
184
-
185
-
186
-
187
-
188
-
189
-
190
-
191
-
192
-
193
-
194
-
195
-
196
-
197
-
198
-
199
-
200
-
201
-
202
-
203
-
204
-
205
-
206
-
207
-
208
-
209
-
210
-
211
-
212
-
213
-
214
-
215
-
216
-
217
-
218
-
219
-
220
-
221
-
222
-
223
-
224
-
225
-
226
-
227
-
228
-
229
-
230
-
231
-
232
-
233
-
234
-
235
-
236
-
237
-
238
-
239
-
240
-
241
-
242
-
243
-
244
-
245
-
246
-
247
-
248
-
249
-
250
-
251
-
252
-
253
-
254
-
255
-
256
-
257
-
258
-
259
-
260
-
261
-
262
-
263
-
264
-
265
-
266
-
267
-
268
-
269
-
270
-
271
-
272
-
273
-
274
-
275
-
276
-
277
-
278
-
279
-
280
-
281
-
282
-
283
-
284
-
285
-
286
-
287
-
288
-
289
-
290
-
291
-
292
-
293
-
294
-
295
-
296
-
297
-
298
-
299
-
300
-
301
-
302
-
303
-
304
-
305
-
306
-
307
-
308
-
309
-
310
-
311
-
312
-
313
-
314
-
315
-
316
-
317
-
318
-
319
-
320
-
321
-
322
-
323
-
324
-
325
-
326
-
327
-
328
-
329
-
330
-
331
-
332
-
333
-
334
-
335
-
336
-
337
-
338
-
339
-
340
-
341
-
342
 |
 |

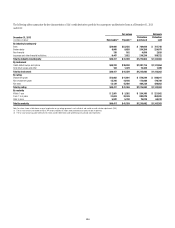
135
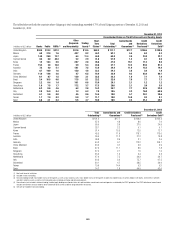
Fair values Notionals
December 31, 2012
In millions of dollars Receivable (1) Payable (2)
Protection
purchased
Protection
sold
By industry/counterparty
Bank $33,938 $31,914 $ 914,542 $ 863,411
Broker-dealer 13,302 14,098 321,418 304,968
Monoline 5 — 141 —
Non-financial 210 164 4,022 3,241
Insurance and other financial institutions 6,671 6,486 194,166 174,874
Total by industry/counterparty $54,126 $52,662 $1,434,289 $1,346,494
By instrument
Credit default swaps and options $54,024 $51,270 $1,421,122 $1,345,162
Total return swaps and other 102 1,392 13,167 1,332
Total by instrument $54,126 $52,662 $1,434,289 $1,346,494
By rating
Investment grade $17,236 $16,252 $ 694,590 $ 637,343
Non-investment grade 22,385 20,420 210,478 200,529
Not rated 14,505 15,990 529,221 508,622
Total by rating $54,126 $52,662 $1,434,289 $1,346,494
By maturity
Within 1 year $ 4,826 $ 5,324 $ 311,202 $ 287,670
From 1 to 5 years 37,660 37,311 1,014,459 965,059
After 5 years 11,640 10,027 108,628 93,765
Total by maturity $54,126 $52,662 $1,434,289 $1,346,494
Note: Fair values shown in table above are prior to application of any netting agreements, cash collateral, and market or CVA.
(1) The fair value amounts receivable were $34,416 million and $19,710 million under protection purchased and sold, respectively.
(2) The fair value amounts payable were $20,832 million and $31,830 million under protection purchased and sold, respectively.