Citibank 2013 Annual Report Download - page 295
Download and view the complete annual report
Please find page 295 of the 2013 Citibank annual report below. You can navigate through the pages in the report by either clicking on the pages listed below, or by using the keyword search tool below to find specific information within the annual report.-
 1
1 -
2
-
3
-
4
-
5
-
6
-
7
-
8
-
9
-
10
-
11
-
12
-
13
-
14
-
15
-
16
-
17
-
18
-
19
-
20
-
21
-
22
-
23
-
24
-
25
-
26
-
27
-
28
-
29
-
30
-
31
-
32
-
33
-
34
-
35
-
36
-
37
-
38
-
39
-
40
-
41
-
42
-
43
-
44
-
45
-
46
-
47
-
48
-
49
-
50
-
51
-
52
-
53
-
54
-
55
-
56
-
57
-
58
-
59
-
60
-
61
-
62
-
63
-
64
-
65
-
66
-
67
-
68
-
69
-
70
-
71
-
72
-
73
-
74
-
75
-
76
-
77
-
78
-
79
-
80
-
81
-
82
-
83
-
84
-
85
-
86
-
87
-
88
-
89
-
90
-
91
-
92
-
93
-
94
-
95
-
96
-
97
-
98
-
99
-
100
-
101
-
102
-
103
-
104
-
105
-
106
-
107
-
108
-
109
-
110
-
111
-
112
-
113
-
114
-
115
-
116
-
117
-
118
-
119
-
120
-
121
-
122
-
123
-
124
-
125
-
126
-
127
-
128
-
129
-
130
-
131
-
132
-
133
-
134
-
135
-
136
-
137
-
138
-
139
-
140
-
141
-
142
-
143
-
144
-
145
-
146
-
147
-
148
-
149
-
150
-
151
-
152
-
153
-
154
-
155
-
156
-
157
-
158
-
159
-
160
-
161
-
162
-
163
-
164
-
165
-
166
-
167
-
168
-
169
-
170
-
171
-
172
-
173
-
174
-
175
-
176
-
177
-
178
-
179
-
180
-
181
-
182
-
183
-
184
-
185
-
186
-
187
-
188
-
189
-
190
-
191
-
192
-
193
-
194
-
195
-
196
-
197
-
198
-
199
-
200
-
201
-
202
-
203
-
204
-
205
-
206
-
207
-
208
-
209
-
210
-
211
-
212
-
213
-
214
-
215
-
216
-
217
-
218
-
219
-
220
-
221
-
222
-
223
-
224
-
225
-
226
-
227
-
228
-
229
-
230
-
231
-
232
-
233
-
234
-
235
-
236
-
237
-
238
-
239
-
240
-
241
-
242
-
243
-
244
-
245
-
246
-
247
-
248
-
249
-
250
-
251
-
252
-
253
-
254
-
255
-
256
-
257
-
258
-
259
-
260
-
261
-
262
-
263
-
264
-
265
-
266
-
267
-
268
-
269
-
270
-
271
-
272
-
273
-
274
-
275
-
276
-
277
-
278
-
279
-
280
-
281
-
282
-
283
-
284
-
 285
285 -
 286
286 -
 287
287 -
 288
288 -
 289
289 -
 290
290 -
 291
291 -
 292
292 -
 293
293 -
 294
294 -
 295
295 -
 296
296 -
 297
297 -
 298
298 -
 299
299 -
 300
300 -
 301
301 -
 302
302 -
 303
303 -
 304
304 -
 305
305 -
306
-
307
-
308
-
309
-
310
-
311
-
312
-
313
-
314
-
315
-
316
-
317
-
318
-
319
-
320
-
321
-
322
-
323
-
324
-
325
-
326
-
327
-
328
-
329
-
330
-
331
-
332
-
333
-
334
-
335
-
336
-
337
-
338
-
339
-
340
-
341
-
342
 |
 |
277
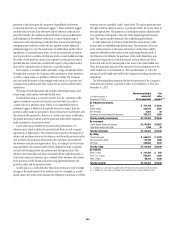
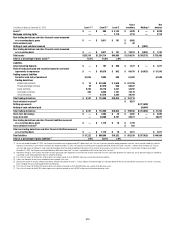
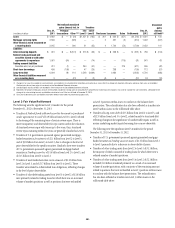
In millions of dollars at December 31, 2012 Level 1 (1) Level 2
(1) Level 3
Gross
inventory Netting
(2)
Net
balance
Loans (4) $ — $ 356 $ 4,931 $ 5,287 $ — $ 5,287
Mortgage servicing rights — — 1,942 1,942 — 1,942
Non-trading derivatives and other financial assets measured
on a recurring basis, gross $ — $ 15,293 $ 2,452 $ 17,745
Cash collateral paid $ 214
Netting of cash collateral received $ (4,660)
Non-trading derivatives and other financial assets measured
on a recurring basis $ — $ 15,293 $ 2,452 $ 17,959 $ (4,660) $ 13,299
Total assets $184,011 $1,614,459 $ 49,312 $1,853,593 $ (1,057,084) $796,509
Total as a percentage of gross assets (5) 10.0% 87.4% 2.7%
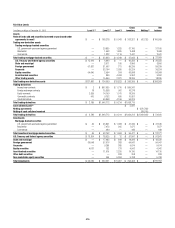
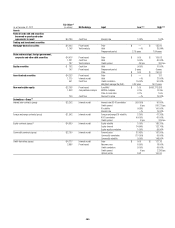
Liabilities
Interest-bearing deposits $ — $ 661 $ 786 $ 1,447 $ — $ 1,447
Federal funds purchased and securities loaned or sold under
agreements to repurchase — 158,580 841 159,421 (42,732) 116,689
Trading account liabilities
Securities sold, not yet purchased 55,145 8,288 365 63,798 63,798
Trading account derivatives
Interest rate contracts $ 1 $ 890,362 $ 1,529 $ 891,892
Foreign exchange contracts 10 81,137 902 82,049
Equity contracts 2,664 25,986 3,189 31,839
Commodity contracts 317 10,348 1,466 12,131
Credit derivatives — 47,746 4,508 52,254
Total trading derivatives $ 2,992 $1,055,579 $ 11,594 $1,070,165
Cash collateral received (6) $ 7,923
Netting agreements $ (970,782)
Netting of cash collateral paid (55,555)
Total trading derivatives $ 2,992 $1,055,579 $ 11,594 $1,078,088 $ (1,026,337) $ 51,751
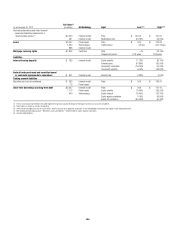
Short-term borrowings — 706 112 818 — 818
Long-term debt — 23,038 6,726 29,764 — 29,764
Non-trading derivatives and other financial liabilities measured
on a recurring basis, gross $ — $ 2,228 $ 24 $ 2,252
Cash collateral received (7) $ 658
Non-trading derivatives and other financial liabilities measured
on a recurring basis $ — $ 2,228 $ 24 $ 2,910 $ — $ 2,910
Total liabilities $ 58,137 $1,249,080 $ 20,448 $1,336,246 $ (1,069,069) $267,177
Total as a percentage of gross liabilities (5) 4.4% 94.1% 1.5%
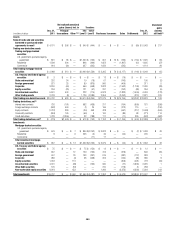
(1) For the year ended December 31, 2012, the Company transferred assets of $1.7 billion from Level 1 to Level 2, primarily related to foreign government bonds, which were not traded with enough frequency to
constitute an active market. During the year ended December 31, 2012, the Company transferred assets of $1.2 billion from Level 2 to Level 1 primarily related to foreign government bonds, which were traded with
sufficient frequency to constitute an active market. During the year ended December 31, 2012, the Company transferred liabilities of $70 million from Level 1 to Level 2, and liabilities of $150 million from Level 2 to
Level 1.
(2) Represents netting of: (i) the amounts due under securities purchased under agreements to resell and the amounts owed under securities sold under agreements to repurchase; and (ii) derivative exposures covered by
a qualifying master netting agreement and cash collateral offsetting.
(3) This is the net amount of the $61,152 million of gross cash collateral paid, of which $55,555 million was used to offset derivative liabilities.
(4) There is no allowance for loan losses recorded for loans reported at fair value.
(5) Because the amount of the cash collateral received has not been allocated to the Level 1, 2 and 3 subtotals, these percentages are calculated based on total assets and liabilities measured at fair value on a recurring
basis, excluding the cash collateral paid/received on derivatives.
(6) This is the net amount of the $46,833 million of gross cash collateral received, of which $38,910 million was used to offset derivative assets.
(7) This is the net amount of the $5,318 million of gross cash collateral received, of which $4,660 million was used to offset derivative liabilities.