Citibank 2013 Annual Report Download - page 28
Download and view the complete annual report
Please find page 28 of the 2013 Citibank annual report below. You can navigate through the pages in the report by either clicking on the pages listed below, or by using the keyword search tool below to find specific information within the annual report.-
 1
1 -
2
-
3
-
4
-
5
-
6
-
7
-
8
-
9
-
10
-
11
-
12
-
13
-
14
-
15
-
16
-
17
-
 18
18 -
 19
19 -
 20
20 -
 21
21 -
 22
22 -
 23
23 -
 24
24 -
 25
25 -
 26
26 -
 27
27 -
 28
28 -
 29
29 -
 30
30 -
 31
31 -
 32
32 -
 33
33 -
 34
34 -
 35
35 -
 36
36 -
 37
37 -
 38
38 -
39
-
40
-
41
-
42
-
43
-
44
-
45
-
46
-
47
-
48
-
49
-
50
-
51
-
52
-
53
-
54
-
55
-
56
-
57
-
58
-
59
-
60
-
61
-
62
-
63
-
64
-
65
-
66
-
67
-
68
-
69
-
70
-
71
-
72
-
73
-
74
-
75
-
76
-
77
-
78
-
79
-
80
-
81
-
82
-
83
-
84
-
85
-
86
-
87
-
88
-
89
-
90
-
91
-
92
-
93
-
94
-
95
-
96
-
97
-
98
-
99
-
100
-
101
-
102
-
103
-
104
-
105
-
106
-
107
-
108
-
109
-
110
-
111
-
112
-
113
-
114
-
115
-
116
-
117
-
118
-
119
-
120
-
121
-
122
-
123
-
124
-
125
-
126
-
127
-
128
-
129
-
130
-
131
-
132
-
133
-
134
-
135
-
136
-
137
-
138
-
139
-
140
-
141
-
142
-
143
-
144
-
145
-
146
-
147
-
148
-
149
-
150
-
151
-
152
-
153
-
154
-
155
-
156
-
157
-
158
-
159
-
160
-
161
-
162
-
163
-
164
-
165
-
166
-
167
-
168
-
169
-
170
-
171
-
172
-
173
-
174
-
175
-
176
-
177
-
178
-
179
-
180
-
181
-
182
-
183
-
184
-
185
-
186
-
187
-
188
-
189
-
190
-
191
-
192
-
193
-
194
-
195
-
196
-
197
-
198
-
199
-
200
-
201
-
202
-
203
-
204
-
205
-
206
-
207
-
208
-
209
-
210
-
211
-
212
-
213
-
214
-
215
-
216
-
217
-
218
-
219
-
220
-
221
-
222
-
223
-
224
-
225
-
226
-
227
-
228
-
229
-
230
-
231
-
232
-
233
-
234
-
235
-
236
-
237
-
238
-
239
-
240
-
241
-
242
-
243
-
244
-
245
-
246
-
247
-
248
-
249
-
250
-
251
-
252
-
253
-
254
-
255
-
256
-
257
-
258
-
259
-
260
-
261
-
262
-
263
-
264
-
265
-
266
-
267
-
268
-
269
-
270
-
271
-
272
-
273
-
274
-
275
-
276
-
277
-
278
-
279
-
280
-
281
-
282
-
283
-
284
-
285
-
286
-
287
-
288
-
289
-
290
-
291
-
292
-
293
-
294
-
295
-
296
-
297
-
298
-
299
-
300
-
301
-
302
-
303
-
304
-
305
-
306
-
307
-
308
-
309
-
310
-
311
-
312
-
313
-
314
-
315
-
316
-
317
-
318
-
319
-
320
-
321
-
322
-
323
-
324
-
325
-
326
-
327
-
328
-
329
-
330
-
331
-
332
-
333
-
334
-
335
-
336
-
337
-
338
-
339
-
340
-
341
-
342
 |
 |

10
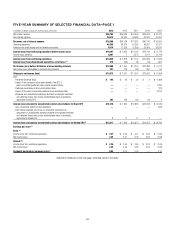
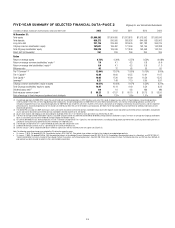
FIVE-YEAR SUMMARY OF SELECTED FINANCIAL DATA—PAGE 1
In millions of dollars, except per-share amounts and ratios 2013 2012 2011 2010 2009
Net interest revenue $46,793 $46,686 $47,649 $53,539 $ 47,973
Non-interest revenue 29,573 22,442 29,682 32,237 31,592
Revenues, net of interest expense $76,366 $69,128 $77,331 $85,776 $ 79,565
Operating expenses 48,355 49,974 50,250 46,851 47,371
Provisions for credit losses and for benefits and claims 8,514 11,329 12,359 25,809 39,970
Income (loss) from continuing operations before income taxes $19,497 $ 7,825 $14,722 $13,116 $ (7,776)
Income taxes (benefits) 5,867 7 3,575 2,217 (6,716)
Income (loss) from continuing operations $13,630 $ 7,818 $11,147 $10,899 $ (1,060)
Income (loss) from discontinued operations, net of taxes (1) 270 (58) 68 (16) (451)
Net income (loss) before attribution of noncontrolling interests $13,900 $ 7,760 $11,215 $10,883 $ (1,511)
Net income (loss) attributable to noncontrolling interests 227 219 148 281 95
Citigroup’s net income (loss) $13,673 $ 7,541 $ 11,067 $10,602 $ (1,606)
Less:
Preferred dividends-Basic $ 194 $ 26 $ 26 $ 9 $ 2,988
Impact of the conversion price reset related to the $12.5
billion convertible preferred stock private issuance-Basic —— — — 1,285
Preferred stock Series H discount accretion-Basic —— — — 123
Impact of the public and private preferred stock exchange offers —— — — 3,242
Dividends and undistributed earnings allocated to employee restricted
and deferred shares that contain nonforfeitable rights to dividends,
applicable to Basic EPS 263 166 186 90 2
Income (loss) allocated to unrestricted common shareholders for Basic EPS $13,216 $ 7,349 $10,855 $10,503 $ (9,246)
Less: Convertible preferred stock dividends —— — — (540)
Add: Interest expense, net of tax, on convertible securities and
adjustment of undistributed earnings allocated to employee restricted
and deferred shares that contain nonforfeitable rights to dividends,
applicable to diluted EPS 111 17 2 —
Income (loss) allocated to unrestricted common shareholders for diluted EPS (2) $13,217 $ 7,360 $10,872 $10,505 $ (8,706)
Earnings per share (3)
Basic (3)
Income (loss) from continuing operations $ 4.27 $ 2.53 $ 3.71 $ 3.64 $ (7.60)
Net income (loss) 4.35 2.51 3.73 3.65 (7.99)
Diluted (2)(3)
Income (loss) from continuing operations $ 4.26 $ 2.46 $ 3.60 $ 3.53 $ (7.60)
Net income (loss) 4.35 2.44 3.63 3.54 (7.99)
Dividends declared per common share (3) 0.04 0.04 0.03 — 0.10
Statement continues on the next page, including notes to the table.