Citibank 2013 Annual Report Download - page 294
Download and view the complete annual report
Please find page 294 of the 2013 Citibank annual report below. You can navigate through the pages in the report by either clicking on the pages listed below, or by using the keyword search tool below to find specific information within the annual report.-
 1
1 -
2
-
3
-
4
-
5
-
6
-
7
-
8
-
9
-
10
-
11
-
12
-
13
-
14
-
15
-
16
-
17
-
18
-
19
-
20
-
21
-
22
-
23
-
24
-
25
-
26
-
27
-
28
-
29
-
30
-
31
-
32
-
33
-
34
-
35
-
36
-
37
-
38
-
39
-
40
-
41
-
42
-
43
-
44
-
45
-
46
-
47
-
48
-
49
-
50
-
51
-
52
-
53
-
54
-
55
-
56
-
57
-
58
-
59
-
60
-
61
-
62
-
63
-
64
-
65
-
66
-
67
-
68
-
69
-
70
-
71
-
72
-
73
-
74
-
75
-
76
-
77
-
78
-
79
-
80
-
81
-
82
-
83
-
84
-
85
-
86
-
87
-
88
-
89
-
90
-
91
-
92
-
93
-
94
-
95
-
96
-
97
-
98
-
99
-
100
-
101
-
102
-
103
-
104
-
105
-
106
-
107
-
108
-
109
-
110
-
111
-
112
-
113
-
114
-
115
-
116
-
117
-
118
-
119
-
120
-
121
-
122
-
123
-
124
-
125
-
126
-
127
-
128
-
129
-
130
-
131
-
132
-
133
-
134
-
135
-
136
-
137
-
138
-
139
-
140
-
141
-
142
-
143
-
144
-
145
-
146
-
147
-
148
-
149
-
150
-
151
-
152
-
153
-
154
-
155
-
156
-
157
-
158
-
159
-
160
-
161
-
162
-
163
-
164
-
165
-
166
-
167
-
168
-
169
-
170
-
171
-
172
-
173
-
174
-
175
-
176
-
177
-
178
-
179
-
180
-
181
-
182
-
183
-
184
-
185
-
186
-
187
-
188
-
189
-
190
-
191
-
192
-
193
-
194
-
195
-
196
-
197
-
198
-
199
-
200
-
201
-
202
-
203
-
204
-
205
-
206
-
207
-
208
-
209
-
210
-
211
-
212
-
213
-
214
-
215
-
216
-
217
-
218
-
219
-
220
-
221
-
222
-
223
-
224
-
225
-
226
-
227
-
228
-
229
-
230
-
231
-
232
-
233
-
234
-
235
-
236
-
237
-
238
-
239
-
240
-
241
-
242
-
243
-
244
-
245
-
246
-
247
-
248
-
249
-
250
-
251
-
252
-
253
-
254
-
255
-
256
-
257
-
258
-
259
-
260
-
261
-
262
-
263
-
264
-
265
-
266
-
267
-
268
-
269
-
270
-
271
-
272
-
273
-
274
-
275
-
276
-
277
-
278
-
279
-
280
-
281
-
282
-
283
-
 284
284 -
 285
285 -
 286
286 -
 287
287 -
 288
288 -
 289
289 -
 290
290 -
 291
291 -
 292
292 -
 293
293 -
 294
294 -
 295
295 -
 296
296 -
 297
297 -
 298
298 -
 299
299 -
 300
300 -
 301
301 -
 302
302 -
 303
303 -
 304
304 -
305
-
306
-
307
-
308
-
309
-
310
-
311
-
312
-
313
-
314
-
315
-
316
-
317
-
318
-
319
-
320
-
321
-
322
-
323
-
324
-
325
-
326
-
327
-
328
-
329
-
330
-
331
-
332
-
333
-
334
-
335
-
336
-
337
-
338
-
339
-
340
-
341
-
342
 |
 |

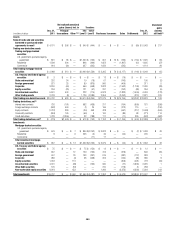
276
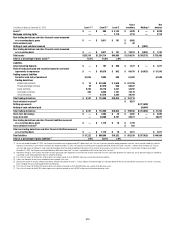
Fair Value Levels
In millions of dollars at December 31, 2012 Level 1 (1) Level 2 (1) Level 3
Gross
inventory Netting (2)
Net
balance
Assets
Federal funds sold and securities borrowed or purchased under
agreements to resell $ — $ 198,278 $ 5,043 $ 203,321 $ (42,732) $160,589
Trading non-derivative assets
Trading mortgage-backed securities
U.S. government-sponsored agency guaranteed — 29,835 1,325 31,160 — 31,160
Residential — 1,663 1,805 3,468 — 3,468
Commercial — 1,322 1,119 2,441 — 2,441
Total trading mortgage-backed securities $ — $ 32,820 $ 4,249 $ 37,069 $ — $ 37,069
U.S. Treasury and federal agency securities $ 15,416 $ 4,940 $ — $ 20,356 $ — $ 20,356
State and municipal — 3,611 195 3,806 — 3,806
Foreign government 57,831 31,097 311 89,239 — 89,239
Corporate — 33,194 2,030 35,224 — 35,224
Equity securities 54,640 2,094 264 56,998 — 56,998
Asset-backed securities — 899 4,453 5,352 — 5,352
Other trading assets — 15,944 2,321 18,265 — 18,265
Total trading non-derivative assets $127,887 $ 124,599 $13,823 $ 266,309 $ — $266,309
Trading derivatives
Interest rate contracts $ 2 $ 897,635 $ 1,710 $ 899,347
Foreign exchange contracts 18 75,358 902 76,278
Equity contracts 2,359 14,109 1,741 18,209
Commodity contracts 410 9,752 695 10,857
Credit derivatives — 49,858 4,166 54,024
Total trading derivatives $ 2,789 $1,046,712 $ 9,214 $1,058,715
Cash collateral paid (3) $ 5,597
Netting agreements $ (970,782)
Netting of cash collateral received (38,910)
Total trading derivatives $ 2,789 $1,046,712 $ 9,214 $1,064,312 $(1,009,692) $ 54,620
Investments
Mortgage-backed securities
U.S. government-sponsored agency guaranteed $ 46 $ 45,841 $ 1,458 $ 47,345 $ — $ 47,345
Residential — 7,472 205 7,677 — 7,677
Commercial — 449 — 449 — 449
Total investment mortgage-backed securities $ 46 $ 53,762 $ 1,663 $ 55,471 $ — $ 55,471
U.S. Treasury and federal agency securities $ 13,204 $ 78,625 $ 12 $ 91,841 $ — $ 91,841
State and municipal $ — $ 17,483 $ 849 $ 18,332 $ — $ 18,332
Foreign government 36,048 57,616 383 94,047 — 94,047
Corporate — 9,289 385 9,674 — 9,674
Equity securities 4,037 132 773 4,942 — 4,942
Asset-backed securities — 11,910 2,220 14,130 — 14,130
Other debt securities — — 258 258 — 258
Non-marketable equity securities — 404 5,364 5,768 — 5,768
Total investments $ 53,335 $ 229,221 $11,907 $ 294,463 $ — $294,463