Citibank 2013 Annual Report Download - page 210
Download and view the complete annual report
Please find page 210 of the 2013 Citibank annual report below. You can navigate through the pages in the report by either clicking on the pages listed below, or by using the keyword search tool below to find specific information within the annual report.-
 1
1 -
2
-
3
-
4
-
5
-
6
-
7
-
8
-
9
-
10
-
11
-
12
-
13
-
14
-
15
-
16
-
17
-
18
-
19
-
20
-
21
-
22
-
23
-
24
-
25
-
26
-
27
-
28
-
29
-
30
-
31
-
32
-
33
-
34
-
35
-
36
-
37
-
38
-
39
-
40
-
41
-
42
-
43
-
44
-
45
-
46
-
47
-
48
-
49
-
50
-
51
-
52
-
53
-
54
-
55
-
56
-
57
-
58
-
59
-
60
-
61
-
62
-
63
-
64
-
65
-
66
-
67
-
68
-
69
-
70
-
71
-
72
-
73
-
74
-
75
-
76
-
77
-
78
-
79
-
80
-
81
-
82
-
83
-
84
-
85
-
86
-
87
-
88
-
89
-
90
-
91
-
92
-
93
-
94
-
95
-
96
-
97
-
98
-
99
-
100
-
101
-
102
-
103
-
104
-
105
-
106
-
107
-
108
-
109
-
110
-
111
-
112
-
113
-
114
-
115
-
116
-
117
-
118
-
119
-
120
-
121
-
122
-
123
-
124
-
125
-
126
-
127
-
128
-
129
-
130
-
131
-
132
-
133
-
134
-
135
-
136
-
137
-
138
-
139
-
140
-
141
-
142
-
143
-
144
-
145
-
146
-
147
-
148
-
149
-
150
-
151
-
152
-
153
-
154
-
155
-
156
-
157
-
158
-
159
-
160
-
161
-
162
-
163
-
164
-
165
-
166
-
167
-
168
-
169
-
170
-
171
-
172
-
173
-
174
-
175
-
176
-
177
-
178
-
179
-
180
-
181
-
182
-
183
-
184
-
185
-
186
-
187
-
188
-
189
-
190
-
191
-
192
-
193
-
194
-
195
-
196
-
197
-
198
-
199
-
 200
200 -
 201
201 -
 202
202 -
 203
203 -
 204
204 -
 205
205 -
 206
206 -
 207
207 -
 208
208 -
 209
209 -
 210
210 -
 211
211 -
 212
212 -
 213
213 -
 214
214 -
 215
215 -
 216
216 -
 217
217 -
 218
218 -
 219
219 -
 220
220 -
221
-
222
-
223
-
224
-
225
-
226
-
227
-
228
-
229
-
230
-
231
-
232
-
233
-
234
-
235
-
236
-
237
-
238
-
239
-
240
-
241
-
242
-
243
-
244
-
245
-
246
-
247
-
248
-
249
-
250
-
251
-
252
-
253
-
254
-
255
-
256
-
257
-
258
-
259
-
260
-
261
-
262
-
263
-
264
-
265
-
266
-
267
-
268
-
269
-
270
-
271
-
272
-
273
-
274
-
275
-
276
-
277
-
278
-
279
-
280
-
281
-
282
-
283
-
284
-
285
-
286
-
287
-
288
-
289
-
290
-
291
-
292
-
293
-
294
-
295
-
296
-
297
-
298
-
299
-
300
-
301
-
302
-
303
-
304
-
305
-
306
-
307
-
308
-
309
-
310
-
311
-
312
-
313
-
314
-
315
-
316
-
317
-
318
-
319
-
320
-
321
-
322
-
323
-
324
-
325
-
326
-
327
-
328
-
329
-
330
-
331
-
332
-
333
-
334
-
335
-
336
-
337
-
338
-
339
-
340
-
341
-
342
 |
 |

192
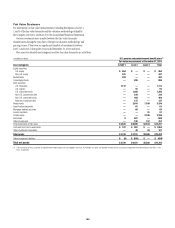
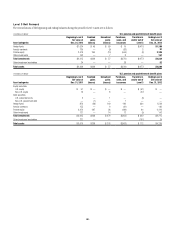
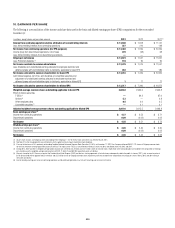
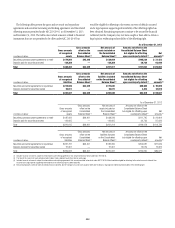
In millions of dollars Non-U.S. pension and postretirement benefit plans
Asset categories
Beginning Level 3
fair value at
Dec. 31, 2012
Realized
gains
(losses)
Unrealized
gains
(losses)
Purchases,
sales, and
issuances
Transfers in
and/or out of
Level 3
Ending Level 3
fair value at
Dec. 31, 2013
Equity securities
Non-U.S. equity $ 48 $ — $ 5 $ — $ (4) $ 49
Debt securities
Non-U.S. government bonds 4 — — — (4) —
Non-U.S. corporate bonds 4 — (1) 2 — 5
Hedge funds 16 — 1 (6) — 11
Annuity contracts 6 — 3 (1) 24 32
Other investments 219 — — 3 (20) 202
Total investments $297 $ — $ 8 $ (2) $ (4) $ 299
Cash and short-term investments 3 — — — (3) —
Total assets $ 300 $ — $ 8 $ (2) $ (7) $ 299
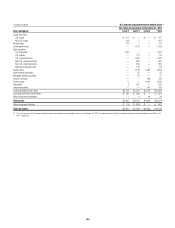
In millions of dollars Non-U.S. pension and postretirement benefit plans
Asset categories
Beginning Level 3
fair value at
Dec. 31, 2011
Realized
gains
(losses)
Unrealized
gains
(losses)
Purchases,
sales, and
issuances
Transfers in
and/or out of
Level 3
Ending Level 3
fair value at
Dec. 31, 2012
Equity securities
Non-U.S. equity $ 5 $ — $ — $ 43 $ — $ 48
Mutual funds 32 — — (10) (22) —
Debt securities
Non-U.S. government bonds 5 — — — (1) 4
Non-U.S. corporate bonds 3 (3) — 2 2 4
Hedge funds 12 — — — 4 16
Annuity contracts — — — 1 5 6
Other investments 240 7 14 (23) (19) 219
Total investments $ 297 $ 4 $ 14 $ 13 $(31) $ 297
Cash and short-term investments — — — — 3 3
Total assets $ 297 $ 4 $ 14 $ 13 $(28) $ 300
Investment Strategy
The Company’s global pension and postretirement funds’ investment
strategies are to invest in a prudent manner for the exclusive purpose of
providing benefits to participants. The investment strategies are targeted
to produce a total return that, when combined with the Company’s
contributions to the funds, will maintain the funds’ ability to meet all
required benefit obligations. Risk is controlled through diversification
of asset types and investments in domestic and international equities,
fixed-income securities and cash and short-term investments. The target
asset allocation in most locations outside the U.S. is primarily in equity
and debt securities. These allocations may vary by geographic region and
country depending on the nature of applicable obligations and various other
regional considerations. The wide variation in the actual range of plan
asset allocations for the funded non-U.S. plans is a result of differing local
statutory requirements and economic conditions. For example, in certain
countries local law requires that all pension plan assets must be invested in
fixed-income investments, government funds, or local-country securities.
Significant Concentrations of Risk in Plan Assets
The assets of the Company’s pension plans are diversified to limit the impact
of any individual investment. The U.S. qualified pension plan is diversified
across multiple asset classes, with publicly traded fixed income, hedge funds,
publicly traded equity, and private equity representing the most significant
asset allocations. Investments in these four asset classes are further diversified
across funds, managers, strategies, vintages, sectors and geographies,
depending on the specific characteristics of each asset class. The pension
assets for the Company’s largest non-U.S. plans are primarily invested in
publicly traded fixed income and publicly traded equity securities.