Citibank 2013 Annual Report Download - page 59
Download and view the complete annual report
Please find page 59 of the 2013 Citibank annual report below. You can navigate through the pages in the report by either clicking on the pages listed below, or by using the keyword search tool below to find specific information within the annual report.-
 1
1 -
2
-
3
-
4
-
5
-
6
-
7
-
8
-
9
-
10
-
11
-
12
-
13
-
14
-
15
-
16
-
17
-
18
-
19
-
20
-
21
-
22
-
23
-
24
-
25
-
26
-
27
-
28
-
29
-
30
-
31
-
32
-
33
-
34
-
35
-
36
-
37
-
38
-
39
-
40
-
41
-
42
-
43
-
44
-
45
-
46
-
47
-
48
-
 49
49 -
 50
50 -
 51
51 -
 52
52 -
 53
53 -
 54
54 -
 55
55 -
 56
56 -
 57
57 -
 58
58 -
 59
59 -
 60
60 -
 61
61 -
 62
62 -
 63
63 -
 64
64 -
 65
65 -
 66
66 -
 67
67 -
 68
68 -
 69
69 -
70
-
71
-
72
-
73
-
74
-
75
-
76
-
77
-
78
-
79
-
80
-
81
-
82
-
83
-
84
-
85
-
86
-
87
-
88
-
89
-
90
-
91
-
92
-
93
-
94
-
95
-
96
-
97
-
98
-
99
-
100
-
101
-
102
-
103
-
104
-
105
-
106
-
107
-
108
-
109
-
110
-
111
-
112
-
113
-
114
-
115
-
116
-
117
-
118
-
119
-
120
-
121
-
122
-
123
-
124
-
125
-
126
-
127
-
128
-
129
-
130
-
131
-
132
-
133
-
134
-
135
-
136
-
137
-
138
-
139
-
140
-
141
-
142
-
143
-
144
-
145
-
146
-
147
-
148
-
149
-
150
-
151
-
152
-
153
-
154
-
155
-
156
-
157
-
158
-
159
-
160
-
161
-
162
-
163
-
164
-
165
-
166
-
167
-
168
-
169
-
170
-
171
-
172
-
173
-
174
-
175
-
176
-
177
-
178
-
179
-
180
-
181
-
182
-
183
-
184
-
185
-
186
-
187
-
188
-
189
-
190
-
191
-
192
-
193
-
194
-
195
-
196
-
197
-
198
-
199
-
200
-
201
-
202
-
203
-
204
-
205
-
206
-
207
-
208
-
209
-
210
-
211
-
212
-
213
-
214
-
215
-
216
-
217
-
218
-
219
-
220
-
221
-
222
-
223
-
224
-
225
-
226
-
227
-
228
-
229
-
230
-
231
-
232
-
233
-
234
-
235
-
236
-
237
-
238
-
239
-
240
-
241
-
242
-
243
-
244
-
245
-
246
-
247
-
248
-
249
-
250
-
251
-
252
-
253
-
254
-
255
-
256
-
257
-
258
-
259
-
260
-
261
-
262
-
263
-
264
-
265
-
266
-
267
-
268
-
269
-
270
-
271
-
272
-
273
-
274
-
275
-
276
-
277
-
278
-
279
-
280
-
281
-
282
-
283
-
284
-
285
-
286
-
287
-
288
-
289
-
290
-
291
-
292
-
293
-
294
-
295
-
296
-
297
-
298
-
299
-
300
-
301
-
302
-
303
-
304
-
305
-
306
-
307
-
308
-
309
-
310
-
311
-
312
-
313
-
314
-
315
-
316
-
317
-
318
-
319
-
320
-
321
-
322
-
323
-
324
-
325
-
326
-
327
-
328
-
329
-
330
-
331
-
332
-
333
-
334
-
335
-
336
-
337
-
338
-
339
-
340
-
341
-
342
 |
 |
41
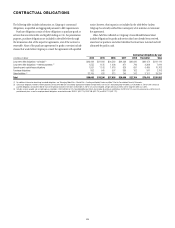
CONTRACTUAL OBLIGATIONS
The following table includes information on Citigroup’s contractual
obligations, as specified and aggregated pursuant to SEC requirements.
Purchase obligations consist of those obligations to purchase goods or
services that are enforceable and legally binding on Citi. For presentation
purposes, purchase obligations are included in the table below through
the termination date of the respective agreements, even if the contract is
renewable. Many of the purchase agreements for goods or services include
clauses that would allow Citigroup to cancel the agreement with specified
notice; however, that impact is not included in the table below (unless
Citigroup has already notified the counterparty of its intention to terminate
the agreement).
Other liabilities reflected on Citigroup’s Consolidated Balance Sheet
include obligations for goods and services that have already been received,
uncertain tax positions and other liabilities that have been incurred and will
ultimately be paid in cash.
Contractual obligations by year
In millions of dollars 2014 2015 2016 2017 2018 Thereafter Total
Long-term debt obligations—principal (1) $43,424 $31,692 $34,580 $24,336 $20,930 $66,154 $221,116
Long-term debt obligations—interest payments (2) 1,555 1,135 1,238 871 749 2,368 7,916
Operating and capital lease obligations 1,557 1,192 1,018 826 681 5,489 10,763
Purchase obligations 852 645 507 380 162 247 2,793
Other liabilities (3) 32,705 632 313 245 242 5,157 39,294
Total $80,093 $35,296 $37,656 $26,658 $22,764 $79,415 $281,882
(1) For additional information about long-term debt obligations, see “Managing Global Risk—Market Risk—Funding and Liquidity” below and Note 18 to the Consolidated Financial Statements.
(2) Contractual obligations related to interest payments on long-term debt are calculated by applying the weighted average interest rate on Citi’s outstanding long-term debt as of December 31, 2013 to the contractual
payment obligations on long-term debt for each of the periods disclosed in the table. At December 31, 2013, Citi’s overall weighted average contractual interest rate for long-term debt was 3.58%.
(3) Includes accounts payable and accrued expenses recorded in Other liabilities on Citi’s Consolidated Balance Sheet. Also includes discretionary contributions for 2014 for Citi’s non-U.S. pension plans and the non-U.S.
postretirement plans, as well as employee benefit obligations accounted for under SFAS 87 (ASC 715), SFAS 106 (ASC 715) and SFAS 112 (ASC 712).