Citibank 2013 Annual Report Download - page 139
Download and view the complete annual report
Please find page 139 of the 2013 Citibank annual report below. You can navigate through the pages in the report by either clicking on the pages listed below, or by using the keyword search tool below to find specific information within the annual report.-
 1
1 -
2
-
3
-
4
-
5
-
6
-
7
-
8
-
9
-
10
-
11
-
12
-
13
-
14
-
15
-
16
-
17
-
18
-
19
-
20
-
21
-
22
-
23
-
24
-
25
-
26
-
27
-
28
-
29
-
30
-
31
-
32
-
33
-
34
-
35
-
36
-
37
-
38
-
39
-
40
-
41
-
42
-
43
-
44
-
45
-
46
-
47
-
48
-
49
-
50
-
51
-
52
-
53
-
54
-
55
-
56
-
57
-
58
-
59
-
60
-
61
-
62
-
63
-
64
-
65
-
66
-
67
-
68
-
69
-
70
-
71
-
72
-
73
-
74
-
75
-
76
-
77
-
78
-
79
-
80
-
81
-
82
-
83
-
84
-
85
-
86
-
87
-
88
-
89
-
90
-
91
-
92
-
93
-
94
-
95
-
96
-
97
-
98
-
99
-
100
-
101
-
102
-
103
-
104
-
105
-
106
-
107
-
108
-
109
-
110
-
111
-
112
-
113
-
114
-
115
-
116
-
117
-
118
-
119
-
120
-
121
-
122
-
123
-
124
-
125
-
126
-
127
-
128
-
 129
129 -
 130
130 -
 131
131 -
 132
132 -
 133
133 -
 134
134 -
 135
135 -
 136
136 -
 137
137 -
 138
138 -
 139
139 -
 140
140 -
 141
141 -
 142
142 -
 143
143 -
 144
144 -
 145
145 -
 146
146 -
 147
147 -
 148
148 -
 149
149 -
150
-
151
-
152
-
153
-
154
-
155
-
156
-
157
-
158
-
159
-
160
-
161
-
162
-
163
-
164
-
165
-
166
-
167
-
168
-
169
-
170
-
171
-
172
-
173
-
174
-
175
-
176
-
177
-
178
-
179
-
180
-
181
-
182
-
183
-
184
-
185
-
186
-
187
-
188
-
189
-
190
-
191
-
192
-
193
-
194
-
195
-
196
-
197
-
198
-
199
-
200
-
201
-
202
-
203
-
204
-
205
-
206
-
207
-
208
-
209
-
210
-
211
-
212
-
213
-
214
-
215
-
216
-
217
-
218
-
219
-
220
-
221
-
222
-
223
-
224
-
225
-
226
-
227
-
228
-
229
-
230
-
231
-
232
-
233
-
234
-
235
-
236
-
237
-
238
-
239
-
240
-
241
-
242
-
243
-
244
-
245
-
246
-
247
-
248
-
249
-
250
-
251
-
252
-
253
-
254
-
255
-
256
-
257
-
258
-
259
-
260
-
261
-
262
-
263
-
264
-
265
-
266
-
267
-
268
-
269
-
270
-
271
-
272
-
273
-
274
-
275
-
276
-
277
-
278
-
279
-
280
-
281
-
282
-
283
-
284
-
285
-
286
-
287
-
288
-
289
-
290
-
291
-
292
-
293
-
294
-
295
-
296
-
297
-
298
-
299
-
300
-
301
-
302
-
303
-
304
-
305
-
306
-
307
-
308
-
309
-
310
-
311
-
312
-
313
-
314
-
315
-
316
-
317
-
318
-
319
-
320
-
321
-
322
-
323
-
324
-
325
-
326
-
327
-
328
-
329
-
330
-
331
-
332
-
333
-
334
-
335
-
336
-
337
-
338
-
339
-
340
-
341
-
342
 |
 |

121
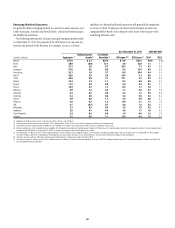
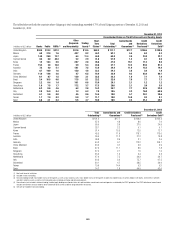
Emerging Markets Exposures
Citi generally defines emerging markets as countries in Latin America, Asia
(other than Japan, Australia and New Zealand), central and eastern Europe,
the Middle East and Africa.
The following table presents Citicorp’s principal emerging markets assets
as of December 31, 2013. For purposes of the table below, loan amounts are
based on the domicile of the borrower. For example, a loan to a Chinese
subsidiaryofaSwitzerland-basedcorporationwillgenerallybecategorized
as a loan in China. Trading account assets and investment securities are
categorized below based on the domicile of the issuer of the security or the
underlying reference entity.
As of December 31, 2013 GCB NCL Rate
In billions of dollars Aggregate (1)
Trading Account
Assets (2)
Investment
Securities (3) ICG Loans (4)(5) GCB Loans (4) 2013 2012
Mexico $74.2 $ 5.7 $27.6 $ 9.6 $31.3 4.0% 3.5%
Korea 39.9 (0.9) 12.1 4.8 23.9 1.1 1.1
India 27.7 3.0 6.7 10.3 7.7 0.7 0.6
Singapore 27.0 0.2 6.6 8.2 12.0 0.3 0.3
Hong Kong 25.7 1.8 3.7 9.8 10.4 0.4 0.4
Brazil (6) 25.6 3.3 3.8 14.4 4.1 6.0 7.0
China 20.8 0.9 3.1 12.1 4.7 0.2 0.6
Taiwan 14.4 1.2 1.1 5.2 6.9 0.0 0.0
Poland 11.2 0.4 6.0 2.0 2.8 0.1 0.7
Russia 10.3 0.7 1.4 6.5 1.7 1.6 1.1
Malaysia 8.9 1.2 0.5 1.7 5.5 0.7 0.8
Indonesia 6.4 0.2 0.6 4.3 1.3 2.5 3.8
Colombia 5.4 0.5 0.6 1.8 2.5 5.2 3.4
Turkey (7) 4.9 0.0 1.7 2.4 0.8 0.0 0.7
Thailand 4.8 0.3 1.5 0.9 2.1 1.7 1.5
UAE 4.1 (0.1) 0.1 2.8 1.3 2.5 3.1
Philippines 3.1 0.3 0.3 1.5 1.0 4.2 4.7
Argentina 2.8 0.1 0.0 1.6 1.1 1.0 0.9
Czech Republic 2.4 0.2 0.6 1.0 0.6 1.3 1.5
Hungary 2.2 0.3 1.1 0.4 0.4 1.5 2.2
(1) Aggregate of Trading account assets, Investment securities, ICG loans and GCB loans.
(2) Trading account assets are shown on a net basis. Citi’s trading account assets will vary as it maintains inventory consistent with customer needs.
(3) Investment securities include securities available for sale, recorded at fair market value, and securities held to maturity, recorded at historical cost.
(4) Reflects funded loans, net of unearned income. In addition to the funded loans disclosed in the table above, through its ICG businesses, Citi had unfunded commitments to corporate customers in the emerging markets
of approximately $37 billion as of December 31, 2013; no country accounted for more than $4 billion of this amount.
(5) As of December 31, 2013, non-accrual loans represented 0.5% of total ICG loans in the emerging markets. For the countries included in the table above, non-accrual loans ratios as of December 31, 2013 ranged
from 0.0% to 0.8%, other than in Hong Kong. In Hong Kong, the non-accrual loan ratio was 2.5% as of December 31, 2013, primarily reflecting the impact of one counterparty.
(6) GCB loans and net credit loss (NCL) rates in Brazil exclude Credicard loans; Credicard was sold in December 2013.
(7) Investment securities in Turkey include Citi’s $1.2 billion investment in Akbank. Citi sold its Consumer operations in Turkey in 2013. For additional information on Citi’s remaining investment in Akbank, see Note 14 to
the Consolidated Financial Statements.