Citibank 2013 Annual Report Download - page 202
Download and view the complete annual report
Please find page 202 of the 2013 Citibank annual report below. You can navigate through the pages in the report by either clicking on the pages listed below, or by using the keyword search tool below to find specific information within the annual report.-
 1
1 -
2
-
3
-
4
-
5
-
6
-
7
-
8
-
9
-
10
-
11
-
12
-
13
-
14
-
15
-
16
-
17
-
18
-
19
-
20
-
21
-
22
-
23
-
24
-
25
-
26
-
27
-
28
-
29
-
30
-
31
-
32
-
33
-
34
-
35
-
36
-
37
-
38
-
39
-
40
-
41
-
42
-
43
-
44
-
45
-
46
-
47
-
48
-
49
-
50
-
51
-
52
-
53
-
54
-
55
-
56
-
57
-
58
-
59
-
60
-
61
-
62
-
63
-
64
-
65
-
66
-
67
-
68
-
69
-
70
-
71
-
72
-
73
-
74
-
75
-
76
-
77
-
78
-
79
-
80
-
81
-
82
-
83
-
84
-
85
-
86
-
87
-
88
-
89
-
90
-
91
-
92
-
93
-
94
-
95
-
96
-
97
-
98
-
99
-
100
-
101
-
102
-
103
-
104
-
105
-
106
-
107
-
108
-
109
-
110
-
111
-
112
-
113
-
114
-
115
-
116
-
117
-
118
-
119
-
120
-
121
-
122
-
123
-
124
-
125
-
126
-
127
-
128
-
129
-
130
-
131
-
132
-
133
-
134
-
135
-
136
-
137
-
138
-
139
-
140
-
141
-
142
-
143
-
144
-
145
-
146
-
147
-
148
-
149
-
150
-
151
-
152
-
153
-
154
-
155
-
156
-
157
-
158
-
159
-
160
-
161
-
162
-
163
-
164
-
165
-
166
-
167
-
168
-
169
-
170
-
171
-
172
-
173
-
174
-
175
-
176
-
177
-
178
-
179
-
180
-
181
-
182
-
183
-
184
-
185
-
186
-
187
-
188
-
189
-
190
-
191
-
 192
192 -
 193
193 -
 194
194 -
 195
195 -
 196
196 -
 197
197 -
 198
198 -
 199
199 -
 200
200 -
 201
201 -
 202
202 -
 203
203 -
 204
204 -
 205
205 -
 206
206 -
 207
207 -
 208
208 -
 209
209 -
 210
210 -
 211
211 -
 212
212 -
213
-
214
-
215
-
216
-
217
-
218
-
219
-
220
-
221
-
222
-
223
-
224
-
225
-
226
-
227
-
228
-
229
-
230
-
231
-
232
-
233
-
234
-
235
-
236
-
237
-
238
-
239
-
240
-
241
-
242
-
243
-
244
-
245
-
246
-
247
-
248
-
249
-
250
-
251
-
252
-
253
-
254
-
255
-
256
-
257
-
258
-
259
-
260
-
261
-
262
-
263
-
264
-
265
-
266
-
267
-
268
-
269
-
270
-
271
-
272
-
273
-
274
-
275
-
276
-
277
-
278
-
279
-
280
-
281
-
282
-
283
-
284
-
285
-
286
-
287
-
288
-
289
-
290
-
291
-
292
-
293
-
294
-
295
-
296
-
297
-
298
-
299
-
300
-
301
-
302
-
303
-
304
-
305
-
306
-
307
-
308
-
309
-
310
-
311
-
312
-
313
-
314
-
315
-
316
-
317
-
318
-
319
-
320
-
321
-
322
-
323
-
324
-
325
-
326
-
327
-
328
-
329
-
330
-
331
-
332
-
333
-
334
-
335
-
336
-
337
-
338
-
339
-
340
-
341
-
342
 |
 |

184
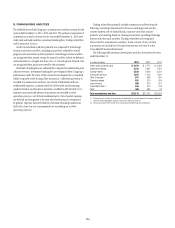
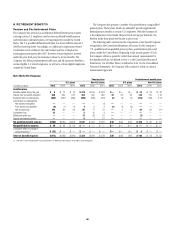
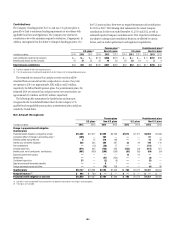
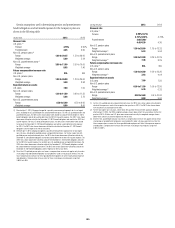
The following table shows the change in Accumulated other
comprehensive income (loss) related to pension and post-retirement benefit
plans for the years ended December 31, 2013, 2012 and 2011:
In millions of dollars 2013 2012 2011
Balance, January 1, net of tax (1) $(5,270) $(4,282) $(4,105)
Cumulative effect of change in accounting policy (22) — —
Actuarial assumptions changes
and plan experience (2) 2,380 (2,400) (820)
Net asset gain (loss) due to difference
between actual and expected returns (1,084) 963 197
Net amortizations 271 214 183
Prior service credit (cost) 360 — —
Foreign exchange impact and other 74 (155) 28
Change in deferred taxes, net (666) 390 235
Change, net of tax $ 1,313 $ (988) $ (177)
Balance, December 31, net of tax (1) $(3,957) $(5,270) $(4,282)
(1) See Note 20 to the Consolidated Financial Statements for further discussion of net Accumulated other
comprehensive income (loss) balance.
(2) Includes $58 million and $62 million of actuarial losses related to the U.S. nonqualified pension plans
for 2013 and 2012, respectively.
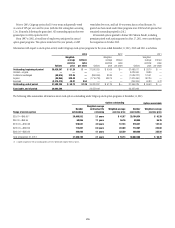
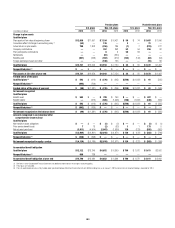
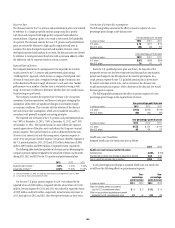
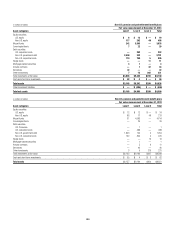
At December 31, 2013 and 2012, for both qualified and nonqualified
pension plans and for both funded and unfunded plans, the aggregate
projected benefit obligation (PBO), the aggregate accumulated benefit
obligation (ABO), and the aggregate fair value of plan assets are presented
for pension plans with a projected benefit obligation in excess of plan assets
and for pension plans with an accumulated benefit obligation in excess of
plan assets as follows:
PBO exceeds fair value of plan assets ABO exceeds fair value plan assets
U.S. plans (1) Non-U.S. plans U.S. plans (1) Non-U.S. plans
In millions of dollars 2013 2012 2013 2012 2013 2012 2013 2012
Projected benefit obligation $692 $14,037 $2,765 $4,792 $692 $14,037 $2,408 $2,608
Accumulated benefit obligation 668 13,984 2,375 3,876 668 13,984 2,090 2,263
Fair value of plan assets —12,656 1,780 3,784 —12,656 1,468 1,677
(1) At December 31, 2013, assets for the U.S. qualified plan exceeded both the projected benefit obligation (PBO) and accumulated benefit obligation (ABO). The U.S. nonqualified plans are not funded and thus the PBO
and ABO exceeded plan assets as of this date. At December 31, 2012, for both the U.S. qualified and nonqualified plans, the aggregate PBO and the aggregate ABO exceeded plan assets. In 2012, the PBO and ABO of
the U.S. plans include $13,268 million and $13,246 million, respectively, relating to the qualified plan and $769 million and $738 million, respectively, relating to the nonqualified plans.
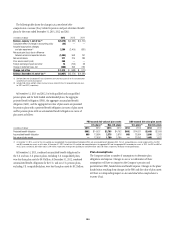
At December 31, 2013, combined accumulated benefit obligations for
the U.S. and non-U.S. pension plans, excluding U.S. nonqualified plans,
were less than plan assets by $0.9 billion. At December 31, 2012, combined
accumulated benefit obligations for the U.S. and non-U.S. pension plans,
excluding U.S. nonqualified plans, were less than plan assets by $0.2 billion.
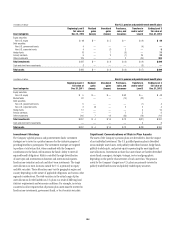
Plan Assumptions
The Company utilizes a number of assumptions to determine plan
obligations and expense. Changes in one or a combination of these
assumptions will have an impact on the Company’s pension and
postretirement PBO, funded status and benefit expense. Changes in the plans’
funded status resulting from changes in the PBO and fair value of plan assets
will have a corresponding impact on Accumulated other comprehensive
income (loss).