Citibank 2013 Annual Report Download - page 5
Download and view the complete annual report
Please find page 5 of the 2013 Citibank annual report below. You can navigate through the pages in the report by either clicking on the pages listed below, or by using the keyword search tool below to find specific information within the annual report.-
 1
1 -
 2
2 -
 3
3 -
 4
4 -
 5
5 -
 6
6 -
 7
7 -
 8
8 -
 9
9 -
 10
10 -
 11
11 -
 12
12 -
 13
13 -
 14
14 -
 15
15 -
 16
16 -
17
-
18
-
19
-
20
-
21
-
22
-
23
-
24
-
25
-
26
-
27
-
28
-
29
-
30
-
31
-
32
-
33
-
34
-
35
-
36
-
37
-
38
-
39
-
40
-
41
-
42
-
43
-
44
-
45
-
46
-
47
-
48
-
49
-
50
-
51
-
52
-
53
-
54
-
55
-
56
-
57
-
58
-
59
-
60
-
61
-
62
-
63
-
64
-
65
-
66
-
67
-
68
-
69
-
70
-
71
-
72
-
73
-
74
-
75
-
76
-
77
-
78
-
79
-
80
-
81
-
82
-
83
-
84
-
85
-
86
-
87
-
88
-
89
-
90
-
91
-
92
-
93
-
94
-
95
-
96
-
97
-
98
-
99
-
100
-
101
-
102
-
103
-
104
-
105
-
106
-
107
-
108
-
109
-
110
-
111
-
112
-
113
-
114
-
115
-
116
-
117
-
118
-
119
-
120
-
121
-
122
-
123
-
124
-
125
-
126
-
127
-
128
-
129
-
130
-
131
-
132
-
133
-
134
-
135
-
136
-
137
-
138
-
139
-
140
-
141
-
142
-
143
-
144
-
145
-
146
-
147
-
148
-
149
-
150
-
151
-
152
-
153
-
154
-
155
-
156
-
157
-
158
-
159
-
160
-
161
-
162
-
163
-
164
-
165
-
166
-
167
-
168
-
169
-
170
-
171
-
172
-
173
-
174
-
175
-
176
-
177
-
178
-
179
-
180
-
181
-
182
-
183
-
184
-
185
-
186
-
187
-
188
-
189
-
190
-
191
-
192
-
193
-
194
-
195
-
196
-
197
-
198
-
199
-
200
-
201
-
202
-
203
-
204
-
205
-
206
-
207
-
208
-
209
-
210
-
211
-
212
-
213
-
214
-
215
-
216
-
217
-
218
-
219
-
220
-
221
-
222
-
223
-
224
-
225
-
226
-
227
-
228
-
229
-
230
-
231
-
232
-
233
-
234
-
235
-
236
-
237
-
238
-
239
-
240
-
241
-
242
-
243
-
244
-
245
-
246
-
247
-
248
-
249
-
250
-
251
-
252
-
253
-
254
-
255
-
256
-
257
-
258
-
259
-
260
-
261
-
262
-
263
-
264
-
265
-
266
-
267
-
268
-
269
-
270
-
271
-
272
-
273
-
274
-
275
-
276
-
277
-
278
-
279
-
280
-
281
-
282
-
283
-
284
-
285
-
286
-
287
-
288
-
289
-
290
-
291
-
292
-
293
-
294
-
295
-
296
-
297
-
298
-
299
-
300
-
301
-
302
-
303
-
304
-
305
-
306
-
307
-
308
-
309
-
310
-
311
-
312
-
313
-
314
-
315
-
316
-
317
-
318
-
319
-
320
-
321
-
322
-
323
-
324
-
325
-
326
-
327
-
328
-
329
-
330
-
331
-
332
-
333
-
334
-
335
-
336
-
337
-
338
-
339
-
340
-
341
-
342
 |
 |
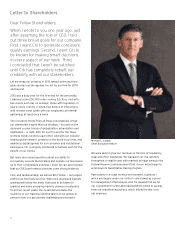
I know that Citi’s culture is robust and that the overwhelming
majority of our people know right from wrong and strive to do
the right thing every day, in all aspects of our work. But I also
know that it takes only one person to jeopardize our credibility.
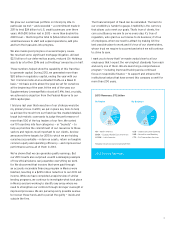
Looking ahead, we’ve set clear goals for 2014. We must
continue on a path to meet our 2015 financial targets. We also
hope to resolve more legacy issues this year, with the aim
of putting the bulk of our financial crisis-era legal overhang
behind us.
With Citi Holdings now comprising only 6% of our balance
sheet, our focus has shifted from selling assets to reducing
the drag that the remaining portfolio causes on our earnings.
We expect to reduce the loss incurred in Holdings further
this year, putting us closer to breakeven. Every dollar saved,
of course, falls directly to the bottom line. And we expect to
continue to utilize our deferred tax assets by generating
U.S. earnings.
In our core businesses, work proceeds to integrate and
streamline our products and services to ensure that we
provide a seamless experience across our offerings and
regions. A monumental effort is under way to transform
our Consumer business from what is, today, too much of an
amalgamation of 36 local banks into one truly global bank.
We’re consolidating platforms, processes and products, all with
the goal of giving our customers a consistently remarkable
experience wherever they live, work or travel and across all
our product lines.
Letter to Shareholders
In the Institutional Clients Group, aligning and integrating
our legacy Markets businesses and our Investor Services and
Direct Custody and Clearing activities will allow us to deliver
a more comprehensive set of capabilities, as well as enable
us to prioritize our resources more efficiently, particularly
around operations and technology. Citi is uniquely positioned
to become the industry-leading integrated services platform
as the business moves to adjust to more demanding capital,
leverage and counterparty risk requirements.
We will continue to invest in our Treasury and Trade Solutions
business, the backbone of our global network, while we
capitalize on our focus on the payments side. This business is
capital friendly and not easily replicable. It took us decades to
build and remains the clear global industry leader.
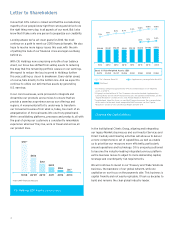
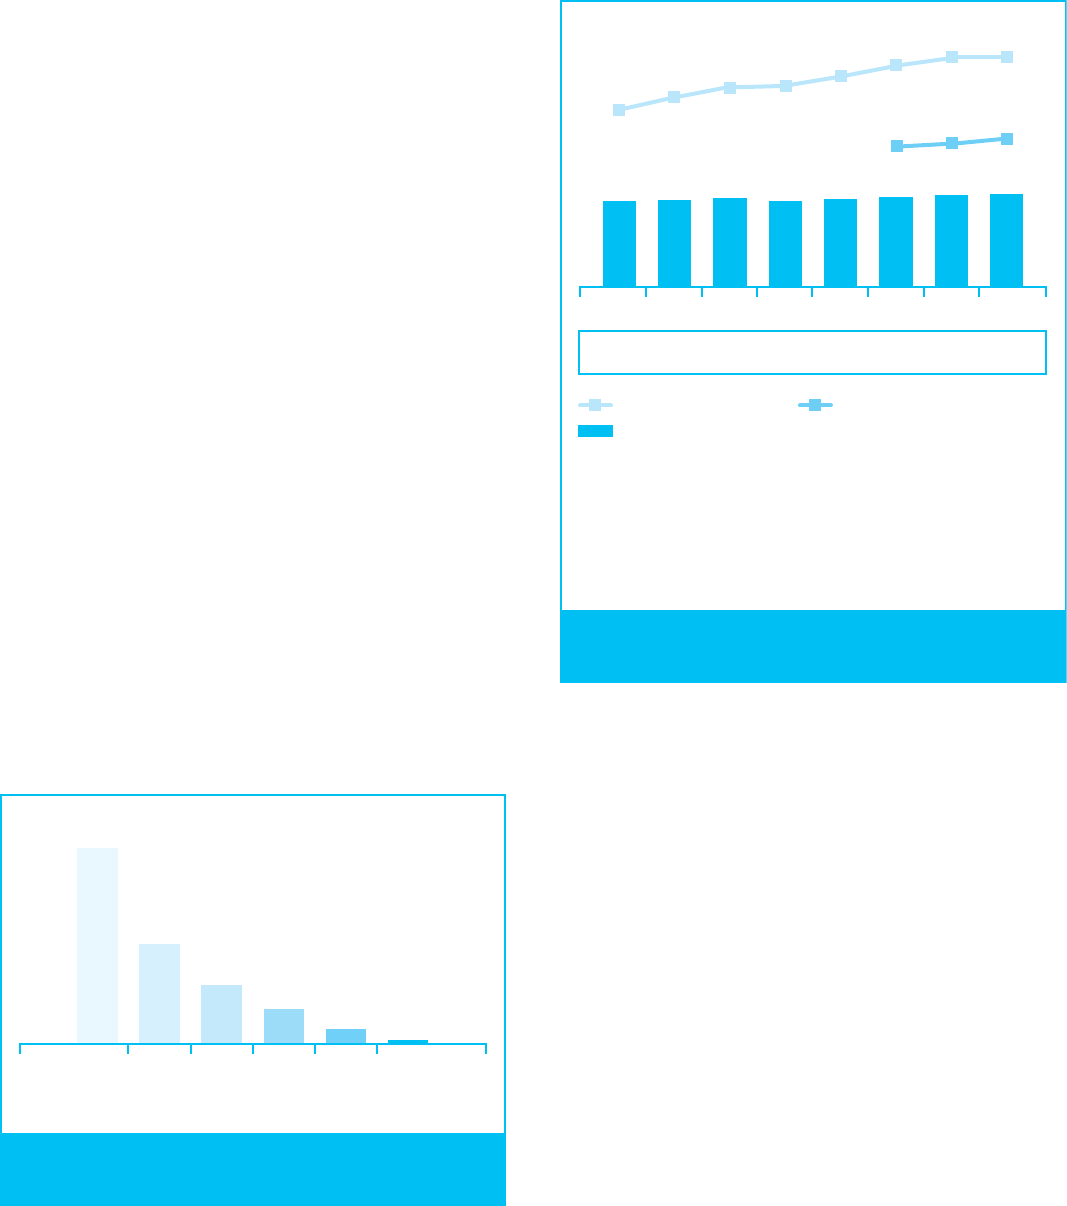
Citigroup Key Capital Metrics
$50.90 $51.81 $52.69 $51.19 $52.35 $53.10 $54.52 $55.31
1Q’12
7.2%
8.6%
7.9 %
2Q’12 3Q’12 4Q’12 1Q’13 2Q’13 3Q’13 4Q’13
$1,272 $1,250 $1,237 $1,206 $1,192 $1,168 $1,159 $1,186
1
8.7% 9.3% 10.0% 10.5% 10.6%
4.9% 5.1% 5.4%
TBV/Share
3
1 Citi Holdings comprised approximately 19% of estimated Basel III risk-weighted
assets as of 4Q’13.
2 Citigroup’s estimated Basel III Tier 1 Common ratio and estimated Supplementary
Leverage Ratio are non-GAAP financial measures. For additional information, see the
“Capital Resources” section of Citi’s 2013 Annual Report on Form 10-K.
3 Tangible Book Value Per Share is a non-GAAP financial measure. For a reconciliation
of this metric to the most direct comparable GAAP measure, see the “Capital
Resources” section of Citi’s 2013 Annual Report on Form 10-K.
Basel III Risk-Weighted Assets ($B)
Tier 1 Common (Basel III)
2
Supplementary Leverage Ratio (Basel III)
2
1Q’08 4Q’10 4Q’12 4Q’134Q’114Q’09
$156 $117
$458
$313
$225
$797
1
1 Non-GAAP financial measure.
Citi Holdings EOP Assets (in billions of dollars)
4