Citibank 2013 Annual Report Download - page 127
Download and view the complete annual report
Please find page 127 of the 2013 Citibank annual report below. You can navigate through the pages in the report by either clicking on the pages listed below, or by using the keyword search tool below to find specific information within the annual report.-
 1
1 -
2
-
3
-
4
-
5
-
6
-
7
-
8
-
9
-
10
-
11
-
12
-
13
-
14
-
15
-
16
-
17
-
18
-
19
-
20
-
21
-
22
-
23
-
24
-
25
-
26
-
27
-
28
-
29
-
30
-
31
-
32
-
33
-
34
-
35
-
36
-
37
-
38
-
39
-
40
-
41
-
42
-
43
-
44
-
45
-
46
-
47
-
48
-
49
-
50
-
51
-
52
-
53
-
54
-
55
-
56
-
57
-
58
-
59
-
60
-
61
-
62
-
63
-
64
-
65
-
66
-
67
-
68
-
69
-
70
-
71
-
72
-
73
-
74
-
75
-
76
-
77
-
78
-
79
-
80
-
81
-
82
-
83
-
84
-
85
-
86
-
87
-
88
-
89
-
90
-
91
-
92
-
93
-
94
-
95
-
96
-
97
-
98
-
99
-
100
-
101
-
102
-
103
-
104
-
105
-
106
-
107
-
108
-
109
-
110
-
111
-
112
-
113
-
114
-
115
-
116
-
 117
117 -
 118
118 -
 119
119 -
 120
120 -
 121
121 -
 122
122 -
 123
123 -
 124
124 -
 125
125 -
 126
126 -
 127
127 -
 128
128 -
 129
129 -
 130
130 -
 131
131 -
 132
132 -
 133
133 -
 134
134 -
 135
135 -
 136
136 -
 137
137 -
138
-
139
-
140
-
141
-
142
-
143
-
144
-
145
-
146
-
147
-
148
-
149
-
150
-
151
-
152
-
153
-
154
-
155
-
156
-
157
-
158
-
159
-
160
-
161
-
162
-
163
-
164
-
165
-
166
-
167
-
168
-
169
-
170
-
171
-
172
-
173
-
174
-
175
-
176
-
177
-
178
-
179
-
180
-
181
-
182
-
183
-
184
-
185
-
186
-
187
-
188
-
189
-
190
-
191
-
192
-
193
-
194
-
195
-
196
-
197
-
198
-
199
-
200
-
201
-
202
-
203
-
204
-
205
-
206
-
207
-
208
-
209
-
210
-
211
-
212
-
213
-
214
-
215
-
216
-
217
-
218
-
219
-
220
-
221
-
222
-
223
-
224
-
225
-
226
-
227
-
228
-
229
-
230
-
231
-
232
-
233
-
234
-
235
-
236
-
237
-
238
-
239
-
240
-
241
-
242
-
243
-
244
-
245
-
246
-
247
-
248
-
249
-
250
-
251
-
252
-
253
-
254
-
255
-
256
-
257
-
258
-
259
-
260
-
261
-
262
-
263
-
264
-
265
-
266
-
267
-
268
-
269
-
270
-
271
-
272
-
273
-
274
-
275
-
276
-
277
-
278
-
279
-
280
-
281
-
282
-
283
-
284
-
285
-
286
-
287
-
288
-
289
-
290
-
291
-
292
-
293
-
294
-
295
-
296
-
297
-
298
-
299
-
300
-
301
-
302
-
303
-
304
-
305
-
306
-
307
-
308
-
309
-
310
-
311
-
312
-
313
-
314
-
315
-
316
-
317
-
318
-
319
-
320
-
321
-
322
-
323
-
324
-
325
-
326
-
327
-
328
-
329
-
330
-
331
-
332
-
333
-
334
-
335
-
336
-
337
-
338
-
339
-
340
-
341
-
342
 |
 |

109
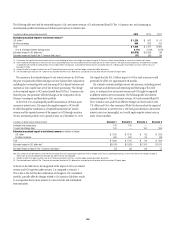
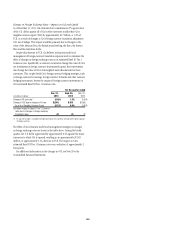
Changes in Foreign Exchange Rates—Impacts on OCI and Capital
As of December 31, 2013, Citi estimates that a simultaneous 5% appreciation
of the U.S. dollar against all of Citi’s other currencies could reduce Citi’s
tangible common equity (TCE) by approximately $1.7 billion, or 1.0% of
TCE, as a result of changes to Citi’s foreign currency translation adjustment
OCI, net of hedges. This impact would be primarily due to changes in the
value of the Mexican Peso, the British pound sterling, the Euro, the Korean
Won and the Australian dollar.
Despite this decrease in TCE, Citi believes its business model and
management of foreign currency translation exposure work to minimize the
effect of changes in foreign exchange rates on its estimated Basel III Tier 1
Common ratio. Specifically, as currency movements change the value of Citi’s
net investments in foreign currency denominated capital, these movements
also change the value of Citi’s risk-weighted assets denominated in those
currencies. This, coupled with Citi’s foreign currency hedging strategies, such
as foreign currency borrowings, foreign currency forwards and other currency
hedging instruments, lessens the impact of foreign currency movements on
Citi’s estimated Basel III Tier 1 Common ratio.
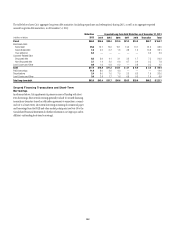
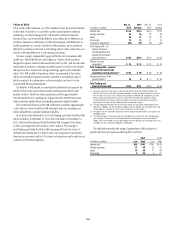
For the quarter ended
In millions of dollars
Dec. 31,
2013
Sept. 30,
2013
Dec. 31,
2012
Change in FX spot rate (1) (0.4)% 1.3% (0.9)%
Change in TCE due to change in FX rate $(241) $ 383 $(295)
As a % of Tangible Common Equity (0.1)% 0.6% (0.6)%
Estimated impact to Basel III Tier 1 Common
ratio due to changes in foreign currency
translation (bps) (2) (1) (2)
(1) FX spot rate change is a weighted average based upon Citi’s quarterly average GAAP capital exposure
to foreign countries.
The effect of Citi’s business model and management strategies on changes
in foreign exchange rates are shown in the table above. During the fourth
quarter, the U.S. dollar appreciated by approximately 0.4% against the major
currencies to which Citi is exposed, resulting in an approximately $(241)
million, or approximately 0.1%, decrease in TCE. The impact on Citi’s
estimated Basel III Tier 1 Common ratio was a reduction of approximately 2
basis points.
For additional information in the changes in OCI, see Note 20 to the
Consolidated Financial Statements.