Citibank 2013 Annual Report Download - page 243
Download and view the complete annual report
Please find page 243 of the 2013 Citibank annual report below. You can navigate through the pages in the report by either clicking on the pages listed below, or by using the keyword search tool below to find specific information within the annual report.-
 1
1 -
2
-
3
-
4
-
5
-
6
-
7
-
8
-
9
-
10
-
11
-
12
-
13
-
14
-
15
-
16
-
17
-
18
-
19
-
20
-
21
-
22
-
23
-
24
-
25
-
26
-
27
-
28
-
29
-
30
-
31
-
32
-
33
-
34
-
35
-
36
-
37
-
38
-
39
-
40
-
41
-
42
-
43
-
44
-
45
-
46
-
47
-
48
-
49
-
50
-
51
-
52
-
53
-
54
-
55
-
56
-
57
-
58
-
59
-
60
-
61
-
62
-
63
-
64
-
65
-
66
-
67
-
68
-
69
-
70
-
71
-
72
-
73
-
74
-
75
-
76
-
77
-
78
-
79
-
80
-
81
-
82
-
83
-
84
-
85
-
86
-
87
-
88
-
89
-
90
-
91
-
92
-
93
-
94
-
95
-
96
-
97
-
98
-
99
-
100
-
101
-
102
-
103
-
104
-
105
-
106
-
107
-
108
-
109
-
110
-
111
-
112
-
113
-
114
-
115
-
116
-
117
-
118
-
119
-
120
-
121
-
122
-
123
-
124
-
125
-
126
-
127
-
128
-
129
-
130
-
131
-
132
-
133
-
134
-
135
-
136
-
137
-
138
-
139
-
140
-
141
-
142
-
143
-
144
-
145
-
146
-
147
-
148
-
149
-
150
-
151
-
152
-
153
-
154
-
155
-
156
-
157
-
158
-
159
-
160
-
161
-
162
-
163
-
164
-
165
-
166
-
167
-
168
-
169
-
170
-
171
-
172
-
173
-
174
-
175
-
176
-
177
-
178
-
179
-
180
-
181
-
182
-
183
-
184
-
185
-
186
-
187
-
188
-
189
-
190
-
191
-
192
-
193
-
194
-
195
-
196
-
197
-
198
-
199
-
200
-
201
-
202
-
203
-
204
-
205
-
206
-
207
-
208
-
209
-
210
-
211
-
212
-
213
-
214
-
215
-
216
-
217
-
218
-
219
-
220
-
221
-
222
-
223
-
224
-
225
-
226
-
227
-
228
-
229
-
230
-
231
-
232
-
 233
233 -
 234
234 -
 235
235 -
 236
236 -
 237
237 -
 238
238 -
 239
239 -
 240
240 -
 241
241 -
 242
242 -
 243
243 -
 244
244 -
 245
245 -
 246
246 -
 247
247 -
 248
248 -
 249
249 -
 250
250 -
 251
251 -
 252
252 -
 253
253 -
254
-
255
-
256
-
257
-
258
-
259
-
260
-
261
-
262
-
263
-
264
-
265
-
266
-
267
-
268
-
269
-
270
-
271
-
272
-
273
-
274
-
275
-
276
-
277
-
278
-
279
-
280
-
281
-
282
-
283
-
284
-
285
-
286
-
287
-
288
-
289
-
290
-
291
-
292
-
293
-
294
-
295
-
296
-
297
-
298
-
299
-
300
-
301
-
302
-
303
-
304
-
305
-
306
-
307
-
308
-
309
-
310
-
311
-
312
-
313
-
314
-
315
-
316
-
317
-
318
-
319
-
320
-
321
-
322
-
323
-
324
-
325
-
326
-
327
-
328
-
329
-
330
-
331
-
332
-
333
-
334
-
335
-
336
-
337
-
338
-
339
-
340
-
341
-
342
 |
 |

225
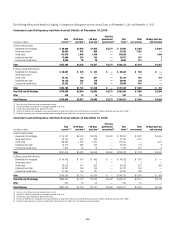
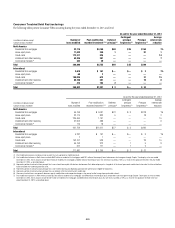
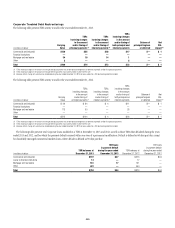
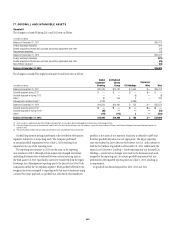
Corporate Troubled Debt Restructurings
The following table presents TDR activity at and for the year ended December 31, 2013.
In millions of dollars
Carrying
Value
TDRs
involving changes
in the amount
and/or timing of
principal payments (1)
TDRs
involving changes
in the amount
and/or timing of
interest payments (2)
TDRs
involving changes
in the amount
and/or timing of
both principal and
interest payments
Balance of
principal forgiven
or deferred
Net
P&L
impact (3)
Commercial and industrial $130 $55 $58 $17 $— $ 1
Financial institutions — — — — — —
Mortgage and real estate 34 19 14 1 — —
Other 5 — — 5 — —
Total $169 $74 $72 $23 $— $ 1
(1) TDRs involving changes in the amount or timing of principal payments may involve principal forgiveness or deferral of periodic and/or final principal payments.
(2) TDRs involving changes in the amount or timing of interest payments may involve a below-market interest rate.
(3) Balances reflect charge-offs and reserves recorded during the year ended December 31, 2013 on loans subject to a TDR during the period then ended.
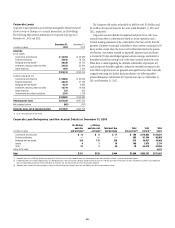
The following table presents TDR activity at and for the year ended December 31, 2012.
In millions of dollars
Carrying
Value
TDRs
involving changes
in the amount
and/or timing of
principal payments (1)
TDRs
involving changes
in the amount
and/or timing of
interest payments (2)
TDRs
involving changes
in the amount
and/or timing of
both principal and
interest payments
Balance of
principal forgiven
or deferred
Net
P&L
impact (3)
Commercial and industrial $ 99 $ 84 $ 4 $11 $— $ 1
Financial institutions — — — — — —
Mortgage and real estate 113 60 — 53 — —
Other — — — — — —
Total $212 $144 $ 4 $64 $— $ 1
(1) TDRs involving changes in the amount or timing of principal payments may involve principal forgiveness or deferral of periodic and/or final principal payments.
(2) TDRs involving changes in the amount or timing of interest payments may involve a below-market interest rate.
(3) Balances reflect charge-offs and reserves recorded during the year ended December 31, 2012 on loans subject to a TDR during the period then ended.
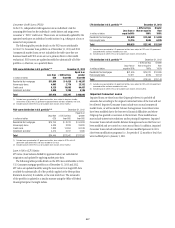
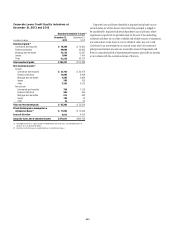
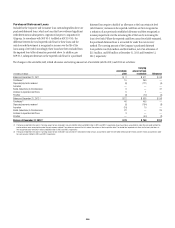
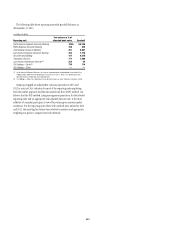
The following table presents total Corporate loans modified in a TDR at December 31, 2013 and 2012, as well as those TDRs that defaulted during the years
ended 2013 and 2012, and for which the payment default occurred within one year of a permanent modification. Default is defined as 60 days past due, except
for classifiably managed commercial markets loans, where default is defined as 90 days past due.
In millions of dollars
TDR balances at
December 31, 2013
TDR loans
in payment default
during the year ended
December 31, 2013
TDR balances at
December 31, 2012
TDR loans
in payment default
during the year ended
December 31, 2012
Commercial and industrial $197 $27 $275 $94
Loans to financial institutions 14 — 17 —
Mortgage and real estate 161 17 131 —
Other 422 — 450 —
Total $794 $44 $873 $94