Citibank 2013 Annual Report Download - page 142
Download and view the complete annual report
Please find page 142 of the 2013 Citibank annual report below. You can navigate through the pages in the report by either clicking on the pages listed below, or by using the keyword search tool below to find specific information within the annual report.-
 1
1 -
2
-
3
-
4
-
5
-
6
-
7
-
8
-
9
-
10
-
11
-
12
-
13
-
14
-
15
-
16
-
17
-
18
-
19
-
20
-
21
-
22
-
23
-
24
-
25
-
26
-
27
-
28
-
29
-
30
-
31
-
32
-
33
-
34
-
35
-
36
-
37
-
38
-
39
-
40
-
41
-
42
-
43
-
44
-
45
-
46
-
47
-
48
-
49
-
50
-
51
-
52
-
53
-
54
-
55
-
56
-
57
-
58
-
59
-
60
-
61
-
62
-
63
-
64
-
65
-
66
-
67
-
68
-
69
-
70
-
71
-
72
-
73
-
74
-
75
-
76
-
77
-
78
-
79
-
80
-
81
-
82
-
83
-
84
-
85
-
86
-
87
-
88
-
89
-
90
-
91
-
92
-
93
-
94
-
95
-
96
-
97
-
98
-
99
-
100
-
101
-
102
-
103
-
104
-
105
-
106
-
107
-
108
-
109
-
110
-
111
-
112
-
113
-
114
-
115
-
116
-
117
-
118
-
119
-
120
-
121
-
122
-
123
-
124
-
125
-
126
-
127
-
128
-
129
-
130
-
131
-
 132
132 -
 133
133 -
 134
134 -
 135
135 -
 136
136 -
 137
137 -
 138
138 -
 139
139 -
 140
140 -
 141
141 -
 142
142 -
 143
143 -
 144
144 -
 145
145 -
 146
146 -
 147
147 -
 148
148 -
 149
149 -
 150
150 -
 151
151 -
 152
152 -
153
-
154
-
155
-
156
-
157
-
158
-
159
-
160
-
161
-
162
-
163
-
164
-
165
-
166
-
167
-
168
-
169
-
170
-
171
-
172
-
173
-
174
-
175
-
176
-
177
-
178
-
179
-
180
-
181
-
182
-
183
-
184
-
185
-
186
-
187
-
188
-
189
-
190
-
191
-
192
-
193
-
194
-
195
-
196
-
197
-
198
-
199
-
200
-
201
-
202
-
203
-
204
-
205
-
206
-
207
-
208
-
209
-
210
-
211
-
212
-
213
-
214
-
215
-
216
-
217
-
218
-
219
-
220
-
221
-
222
-
223
-
224
-
225
-
226
-
227
-
228
-
229
-
230
-
231
-
232
-
233
-
234
-
235
-
236
-
237
-
238
-
239
-
240
-
241
-
242
-
243
-
244
-
245
-
246
-
247
-
248
-
249
-
250
-
251
-
252
-
253
-
254
-
255
-
256
-
257
-
258
-
259
-
260
-
261
-
262
-
263
-
264
-
265
-
266
-
267
-
268
-
269
-
270
-
271
-
272
-
273
-
274
-
275
-
276
-
277
-
278
-
279
-
280
-
281
-
282
-
283
-
284
-
285
-
286
-
287
-
288
-
289
-
290
-
291
-
292
-
293
-
294
-
295
-
296
-
297
-
298
-
299
-
300
-
301
-
302
-
303
-
304
-
305
-
306
-
307
-
308
-
309
-
310
-
311
-
312
-
313
-
314
-
315
-
316
-
317
-
318
-
319
-
320
-
321
-
322
-
323
-
324
-
325
-
326
-
327
-
328
-
329
-
330
-
331
-
332
-
333
-
334
-
335
-
336
-
337
-
338
-
339
-
340
-
341
-
342
 |
 |

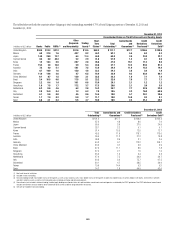
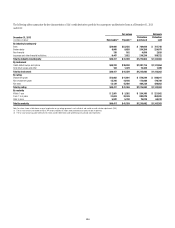
124
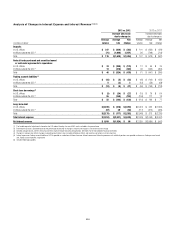
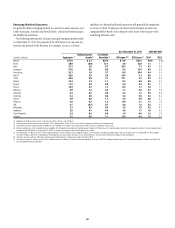
GIIPS Sovereign, Financial Institution and Corporate Exposures
GIIPS (1)
In billions of U.S. dollars Greece Ireland Italy Portugal Spain
December 31,
2013
September 30,
2013
Funded loans, before reserves (2) $ 1.0 $ 0.4 $ 1.2 $ 0.2 $ 2.5 $ 5.3 $ 7.0
Derivative counterparty mark-to-market, inclusive of CVA (3) 0.5 0.5 9.2 0.2 2.9 13.3 12.7
Gross funded credit exposure $ 1.6 $ 0.9 $10.4 $ 0.4 $ 5.4 $18.6 $19.7
Less: margin and collateral (4) $(0.1) $(0.3) $ (1.3) $(0.1) $(2.6) $ (4.3) $ (4.3)
Less: purchased credit protection (5) (0.3) (0.0) (7.9) (0.2) (1.2) (9.6) (9.8)
Net current funded credit exposure $ 1.1 $ 0.6 $ 1.3 $ 0.1 $ 1.6 $ 4.7 $ 5.6
Net trading exposure $ 0.1 $ 0.3 $ 1.4 $ 0.1 $ 2.3 $ 4.2 $ 0.4
AFS exposure 0.0 0.0 0.2 0.0 0.0 0.2 0.3
Net trading and AFS exposure (6) $ 0.1 $ 0.3 $ 1.6 $ 0.1 $ 2.3 $ 4.4 $ 0.6
Net current funded exposure $ 1.2 $ 0.9 $ 2.9 $ 0.2 $ 3.9 $ 9.1 $ 6.2
Additional collateral received, not reducing amounts above (7) $(0.7) $(0.1) $ (0.1) (0.0) $(0.4) $ (1.3) $ (1.3)
Net current funded credit exposure detail
Sovereigns $ 0.2 $ 0.0 $ 0.3 (0.0) $(0.2) $ 0.4 $ 1.1
Financial institutions 0.1 0.1 0.1 0.0 0.9 1.1 0.8
Corporations 0.8 0.5 0.8 0.1 0.9 3.2 $ 3.7
Net current funded credit exposure $ 1.1 $ 0.6 $ 1.3 $ 0.1 $ 1.6 $ 4.7 $ 5.6
Net unfunded commitments (8)
Sovereigns $ 0.0 $ 0.0 $ 0.0 $ 0.0 $ 0.0 $ 0.0 $ 0.0
Financial institutions 0.0 0.0 0.1 0.0 0.5 0.7 0.4
Corporations, net 0.3 0.6 3.0 0.3 2.3 6.4 6.4
Total net unfunded commitments $ 0.3 $ 0.6 $ 3.1 $ 0.3 $ 2.8 $ 7.1 $ 6.8
Note: Totals may not sum due to rounding. The exposures in the table above do not include retail, small business and Citi Private Bank exposures in the GIIPS. See “Retail, Small Business and Citi Private Bank” below. Citi
has exposures to obligors located within the GIIPS that are not included in the table above because Citi’s internal risk management systems determine that the client relationship, taken as a whole, is not in the GIIPS
(e.g., a funded loan to a Greece subsidiary of a Switzerland-based corporation). However, the total amount of such exposures was less than $2.1 billion of funded loans and $3.3 billion of unfunded commitments
across the GIIPS as of December 31, 2013. Further, in addition to the exposures in the table above, Citi, like other banks, provides settlement and clearing facilities for a variety of clients in these countries and
monitors and manages these intra-day exposures.
(1) Greece, Ireland, Italy, Portugal and Spain.
(2) As of December 31, 2013, Citi held $0.3 billion in reserves against these loans.
(3) Includes the net credit exposure arising from secured financing transactions, such as repurchase agreements and reverse repurchase agreements. See “Secured Financing Transactions” below.
(4) For derivatives and loans, includes margin and collateral posted under legally enforceable margin agreements. The majority of this margin and collateral is in the form of cash, with the remainder in predominantly non-
GIIPS securities, which are included at fair value. Does not include collateral received on secured financing transactions.
(5) Credit protection purchased primarily from investment grade, global financial institutions predominantly outside of the GIIPS. See “Credit Default Swaps” below. The amount as of December 31, 2013 included
$0.5 billion of index and tranched credit derivatives (compared to $0.8 billion at September 30, 2013) executed to hedge Citi’s exposure on funded loans and CVA on derivatives, a significant portion of which is
reflected in Italy and Spain.
(6) Includes securities and derivatives with GIIPS sovereigns, financial institutions and corporations as the issuer or reference entity. The net amount as of December 31, 2013 included a net position of $(1.4) billion of
indexed and tranched credit derivatives (compared to a net position of $(1.1) billion at September 30, 2013). The securities and derivatives exposures are marked to market daily. Citi’s trading exposure levels will vary
as it maintains inventory consistent with customer needs.
(7) Collateral received but not netted against Citi’s gross funded credit exposure may take a variety of forms, including securities, receivables and physical assets, and is held under a variety of collateral arrangements.
(8) Unfunded commitments net of approximately $1.4 billion of purchased credit protection as of December 31, 2013. Amount at December 31, 2013 included approximately $6.0 billion of unfunded loan commitments
that generally have standard conditions that must be met before they can be drawn and $2.5 billion of letters of credit (compared to $4.7 billion and $2.1 billion at September 30, 2013, respectively).