Citibank 2013 Annual Report Download - page 259
Download and view the complete annual report
Please find page 259 of the 2013 Citibank annual report below. You can navigate through the pages in the report by either clicking on the pages listed below, or by using the keyword search tool below to find specific information within the annual report.-
 1
1 -
2
-
3
-
4
-
5
-
6
-
7
-
8
-
9
-
10
-
11
-
12
-
13
-
14
-
15
-
16
-
17
-
18
-
19
-
20
-
21
-
22
-
23
-
24
-
25
-
26
-
27
-
28
-
29
-
30
-
31
-
32
-
33
-
34
-
35
-
36
-
37
-
38
-
39
-
40
-
41
-
42
-
43
-
44
-
45
-
46
-
47
-
48
-
49
-
50
-
51
-
52
-
53
-
54
-
55
-
56
-
57
-
58
-
59
-
60
-
61
-
62
-
63
-
64
-
65
-
66
-
67
-
68
-
69
-
70
-
71
-
72
-
73
-
74
-
75
-
76
-
77
-
78
-
79
-
80
-
81
-
82
-
83
-
84
-
85
-
86
-
87
-
88
-
89
-
90
-
91
-
92
-
93
-
94
-
95
-
96
-
97
-
98
-
99
-
100
-
101
-
102
-
103
-
104
-
105
-
106
-
107
-
108
-
109
-
110
-
111
-
112
-
113
-
114
-
115
-
116
-
117
-
118
-
119
-
120
-
121
-
122
-
123
-
124
-
125
-
126
-
127
-
128
-
129
-
130
-
131
-
132
-
133
-
134
-
135
-
136
-
137
-
138
-
139
-
140
-
141
-
142
-
143
-
144
-
145
-
146
-
147
-
148
-
149
-
150
-
151
-
152
-
153
-
154
-
155
-
156
-
157
-
158
-
159
-
160
-
161
-
162
-
163
-
164
-
165
-
166
-
167
-
168
-
169
-
170
-
171
-
172
-
173
-
174
-
175
-
176
-
177
-
178
-
179
-
180
-
181
-
182
-
183
-
184
-
185
-
186
-
187
-
188
-
189
-
190
-
191
-
192
-
193
-
194
-
195
-
196
-
197
-
198
-
199
-
200
-
201
-
202
-
203
-
204
-
205
-
206
-
207
-
208
-
209
-
210
-
211
-
212
-
213
-
214
-
215
-
216
-
217
-
218
-
219
-
220
-
221
-
222
-
223
-
224
-
225
-
226
-
227
-
228
-
229
-
230
-
231
-
232
-
233
-
234
-
235
-
236
-
237
-
238
-
239
-
240
-
241
-
242
-
243
-
244
-
245
-
246
-
247
-
248
-
 249
249 -
 250
250 -
 251
251 -
 252
252 -
 253
253 -
 254
254 -
 255
255 -
 256
256 -
 257
257 -
 258
258 -
 259
259 -
 260
260 -
 261
261 -
 262
262 -
 263
263 -
 264
264 -
 265
265 -
 266
266 -
 267
267 -
 268
268 -
 269
269 -
270
-
271
-
272
-
273
-
274
-
275
-
276
-
277
-
278
-
279
-
280
-
281
-
282
-
283
-
284
-
285
-
286
-
287
-
288
-
289
-
290
-
291
-
292
-
293
-
294
-
295
-
296
-
297
-
298
-
299
-
300
-
301
-
302
-
303
-
304
-
305
-
306
-
307
-
308
-
309
-
310
-
311
-
312
-
313
-
314
-
315
-
316
-
317
-
318
-
319
-
320
-
321
-
322
-
323
-
324
-
325
-
326
-
327
-
328
-
329
-
330
-
331
-
332
-
333
-
334
-
335
-
336
-
337
-
338
-
339
-
340
-
341
-
342
 |
 |

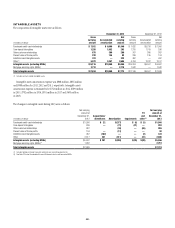
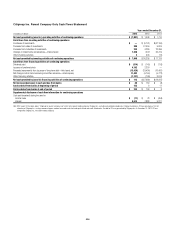
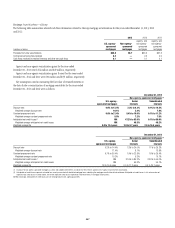
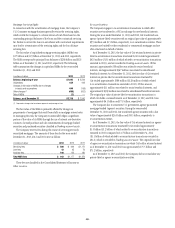
241
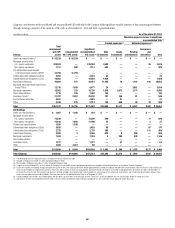
Citigroup’s involvement with consolidated and unconsolidated VIEs with which the Company holds significant variable interests or has continuing involvement
through servicing a majority of the assets in a VIE, each as of December 31, 2013 and 2012, is presented below:
In millions of dollars As of December 31, 2013
Maximum exposure to loss in significant
unconsolidated VIEs (1)
Funded exposures (2) Unfunded exposures (3)
Citicorp
Total
involvement
with SPE
assets
Consolidated
VIE / SPE assets
Significant
unconsolidated
VIE assets (4)
Debt
investments
Equity
investments
Funding
commitments
Guarantees
and
derivatives Total
Credit card securitizations (5) $ 52,229 $ 52,229 $ — $ — $ — $ — $ — $ —
Mortgage securitizations (6)
U.S. agency-sponsored 239,204 — 239,204 3,583 — — 36 3,619
Non-agency-sponsored 7,711 598 7,113 583 — — — 583
Citi-administered asset-backed
commercial paper conduits (ABCP) 31,759 31,759 — — — — — —
Collateralized debt obligations (CDOs) 4,204 — 4,204 34 — — — 34
Collateralized loan obligations (CLOs) 16,883 — 16,883 1,938 — — — 1,938
Asset-based financing 45,884 971 44,913 17,452 74 1,132 195 18,853
Municipal securities tender option bond
trusts (TOBs) 12,716 7,039 5,677 29 — 3,881 — 3,910
Municipal investments 15,962 223 15,739 1,846 2,073 1,173 — 5,092
Client intermediation 1,778 195 1,583 145 — — — 145
Investment funds (7) 31,787 2,557 29,230 191 264 81 — 536
Trust preferred securities 4,822 — 4,822 — 51 — — 51
Other 2,439 225 2,214 143 649 20 78 890
Total $467,378 $ 95,796 $371,582 $ 25,944 $3,111 $ 6,287 $ 309 $ 35,651
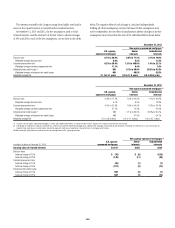
Citi Holdings
Credit card securitizations $ 1,867 $ 1,448 $ 419 $ — $ — $ — $ — $ —
Mortgage securitizations
U.S. agency-sponsored 73,549 — 73,549 549 — — 77 626
Non-agency-sponsored 13,193 1,695 11,498 35 — — 2 37
Student loan securitizations 1,520 1,520 — — — — — —
Collateralized debt obligations (CDOs) 3,625 — 3,625 88 — — 87 175
Collateralized loan obligations (CLOs) 2,733 — 2,733 358 — — 111 469
Asset-based financing 3,508 3 3,505 629 3 258 — 890
Municipal investments 7,304 — 7,304 3 204 939 — 1,146
Client intermediation — — — — — — — —
Investment funds 1,237 — 1,237 — 61 — — 61
Other 4,494 4,434 60 — — — — —
Total $113,030 $ 9,100 $103,930 $ 1,662 $ 268 $ 1,197 $ 277 $ 3,404
Total Citigroup $580,408 $104,896 $475,512 $ 27,606 $3,379 $ 7,484 $ 586 $ 39,055
(1) The definition of maximum exposure to loss is included in the text that follows this table.
(2) Included in Citigroup’s December 31, 2013 Consolidated Balance Sheet.
(3) Not included in Citigroup’s December 31, 2013 Consolidated Balance Sheet.
(4) A significant unconsolidated VIE is an entity where the Company has any variable interest considered to be significant, regardless of the likelihood of loss or the notional amount of exposure.
(5) As part of its liquidity and funding strategy, during the first quarter of 2013, the Company elected to remove approximately $27 billion of randomly selected credit card receivables from the Master Trust ($12 billion) and
Omni Trust ($15 billion) that represented a portion of the excess seller’s interest in each trust. Subsequently, during the second half of 2013, Citi elected to add approximately $7.4 billion of credit card receivables to
the Master Trust from the U.S. Citi-branded cards business’ portfolio of eligible unsecuritized credit card receivables (for a discussion of Citi’s credit card securitizations, see “Credit Card Securitizations” below). These
credit card receivables continue to be included in Consumer loans on the Consolidated Balance Sheet as of December 31, 2013.
(6) Citicorp mortgage securitizations also include agency and non-agency (private-label) re-securitization activities. These SPEs are not consolidated. See “Re-securitizations” below for further discussion.
(7) Substantially all of the unconsolidated investment funds’ assets are related to retirement funds in Mexico managed by Citi. See “Investment Funds” below for further discussion.