Citibank 2013 Annual Report Download - page 119
Download and view the complete annual report
Please find page 119 of the 2013 Citibank annual report below. You can navigate through the pages in the report by either clicking on the pages listed below, or by using the keyword search tool below to find specific information within the annual report.-
 1
1 -
2
-
3
-
4
-
5
-
6
-
7
-
8
-
9
-
10
-
11
-
12
-
13
-
14
-
15
-
16
-
17
-
18
-
19
-
20
-
21
-
22
-
23
-
24
-
25
-
26
-
27
-
28
-
29
-
30
-
31
-
32
-
33
-
34
-
35
-
36
-
37
-
38
-
39
-
40
-
41
-
42
-
43
-
44
-
45
-
46
-
47
-
48
-
49
-
50
-
51
-
52
-
53
-
54
-
55
-
56
-
57
-
58
-
59
-
60
-
61
-
62
-
63
-
64
-
65
-
66
-
67
-
68
-
69
-
70
-
71
-
72
-
73
-
74
-
75
-
76
-
77
-
78
-
79
-
80
-
81
-
82
-
83
-
84
-
85
-
86
-
87
-
88
-
89
-
90
-
91
-
92
-
93
-
94
-
95
-
96
-
97
-
98
-
99
-
100
-
101
-
102
-
103
-
104
-
105
-
106
-
107
-
108
-
 109
109 -
 110
110 -
 111
111 -
 112
112 -
 113
113 -
 114
114 -
 115
115 -
 116
116 -
 117
117 -
 118
118 -
 119
119 -
 120
120 -
 121
121 -
 122
122 -
 123
123 -
 124
124 -
 125
125 -
 126
126 -
 127
127 -
 128
128 -
 129
129 -
130
-
131
-
132
-
133
-
134
-
135
-
136
-
137
-
138
-
139
-
140
-
141
-
142
-
143
-
144
-
145
-
146
-
147
-
148
-
149
-
150
-
151
-
152
-
153
-
154
-
155
-
156
-
157
-
158
-
159
-
160
-
161
-
162
-
163
-
164
-
165
-
166
-
167
-
168
-
169
-
170
-
171
-
172
-
173
-
174
-
175
-
176
-
177
-
178
-
179
-
180
-
181
-
182
-
183
-
184
-
185
-
186
-
187
-
188
-
189
-
190
-
191
-
192
-
193
-
194
-
195
-
196
-
197
-
198
-
199
-
200
-
201
-
202
-
203
-
204
-
205
-
206
-
207
-
208
-
209
-
210
-
211
-
212
-
213
-
214
-
215
-
216
-
217
-
218
-
219
-
220
-
221
-
222
-
223
-
224
-
225
-
226
-
227
-
228
-
229
-
230
-
231
-
232
-
233
-
234
-
235
-
236
-
237
-
238
-
239
-
240
-
241
-
242
-
243
-
244
-
245
-
246
-
247
-
248
-
249
-
250
-
251
-
252
-
253
-
254
-
255
-
256
-
257
-
258
-
259
-
260
-
261
-
262
-
263
-
264
-
265
-
266
-
267
-
268
-
269
-
270
-
271
-
272
-
273
-
274
-
275
-
276
-
277
-
278
-
279
-
280
-
281
-
282
-
283
-
284
-
285
-
286
-
287
-
288
-
289
-
290
-
291
-
292
-
293
-
294
-
295
-
296
-
297
-
298
-
299
-
300
-
301
-
302
-
303
-
304
-
305
-
306
-
307
-
308
-
309
-
310
-
311
-
312
-
313
-
314
-
315
-
316
-
317
-
318
-
319
-
320
-
321
-
322
-
323
-
324
-
325
-
326
-
327
-
328
-
329
-
330
-
331
-
332
-
333
-
334
-
335
-
336
-
337
-
338
-
339
-
340
-
341
-
342
 |
 |
101
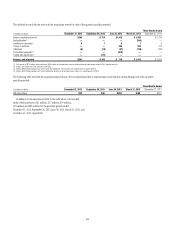
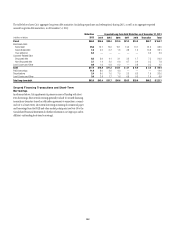
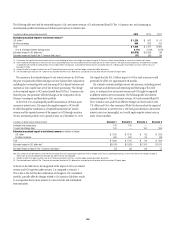
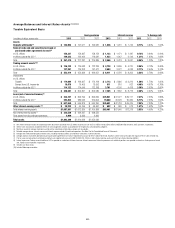
Long-Term Debt Outstanding
The following table sets forth Citi’s total long-term debt outstanding for the
periods indicated:
In billions of dollars
Dec. 31,
2013
Sept 30,
2013
Dec. 31,
2012
Parent $164.7 $168.6 $188.2
Benchmark Debt:
Senior debt 98.5 100.4 109.5
Subordinated debt 28.1 28.0 27.6
Trust preferred 3.9 4.3 10.1
Customer-Related Debt:
Structured debt 22.2 22.0 23.0
Non-Structured debt 7.8 9.2 10.8
Local Country and Other (1) (2) 4.2 4.7 7.2
Bank $ 56.4 $ 53.0 $ 51.3
FHLB Borrowings 14.0 14.3 16.3
Securitizations (3) 33.6 30.3 24.8
Local Country and Other (2) 8.8 8.4 10.2
Total long-term debt $221.1 $221.6 $239.5
Note: Amounts represent the current value of long-term debt on Citi’s Consolidated Balance Sheet which,
for certain debt instruments, includes consideration of fair value, hedging impacts and unamortized
discounts and premiums.
(1) Includes securitizations of $0.2 billion in each period presented.
(2) Local country debt includes debt issued by Citi’s affiliates in support of their local operations.
(3) Of the approximately $33.6 billion of total bank securitizations at December 31, 2013, approximately
$32.4 billion related to credit card securitizations.
As set forth in the table above, Citi’s overall long-term debt decreased
$18 billion year-over-year, although the pace of reductions slowed during
the second half of 2013. At year-end 2013, long-term debt outstanding had
generally stabilized at $221 billion, as continued reductions in parent debt
were offset by increases at the bank. In the bank, the increase in long-term
debt during the year was driven by increased securitizations, specifically
$11.5 billion of credit card securitizations by the Citibank Credit Card
Issuance Trust (CCCIT), given the lower cost of this funding. Going into
2014, Citi expects to maintain its total long-term debt outstanding at
approximately these levels, with a modest further reduction in parent debt
partially offset by continued increased securitization activities at the bank.
Overall, changes in Citi’s long-term debt outstanding will continue to reflect
the funding needs of its businesses. It also will depend on the market and
economic environment and any regulatory changes, such as prescribed
levels of debt required to be maintained by Citi pursuant to the U.S. banking
regulators orderly liquidation authority (for additional information, see
“Risk Factors-Regulatory Risks” above).
As part of its liquidity and funding strategy, Citi has considered, and may
continue to consider, opportunities to repurchase its long-term and short-
term debt pursuant to open market purchases, tender offers or other means.
Such repurchases decrease Citi’s overall funding costs. During 2013, Citi
repurchased an aggregate of approximately $8.0 billion of its outstanding
long-term and short-term debt primarily pursuant to selective public tender
offers and open market purchases. Citi also redeemed $7.3 billion of trust
preferred securities during the year, including $3.0 billion related to the
exchange of trust preferred securities previously held by the U.S. Treasury and
FDIC (for details on Citi’s remaining outstanding trust preferred securities,
see Note 18 to the Consolidated Financial Statements).
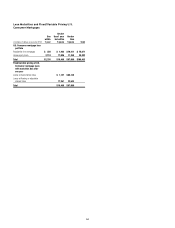
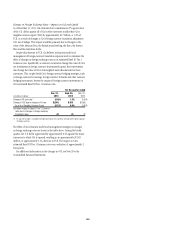
Long-Term Debt Issuances and Maturities
The table below details Citi’s long-term debt issuances and maturities (including repurchases and redemptions) during the periods presented:
2013 2012 2011
In billions of dollars Maturities (1) Issuances (1) Maturities Issuances Maturities Issuances
Parent $46.0 $30.7 $ 75.3 $17.3 $43.3 $20.4
Benchmark Debt:
Senior debt 25.6 17.8 34.9 9.1 21.9 8.0
Subordinated debt 1.0 4.6 1.8 — — —
Trust preferred 6.4 — 5.9 — 1.9 —
Customer-Related Debt:
Structured debt 8.5 7.3 8.2 8.0 5.5 8.8
Non-Structured debt 3.7 1.0 22.1 — 11.4 2.0
Local Country and Other 0.8 — 2.4 0.2 2.6 1.6
Bank $17.8 $23.7 $ 42.3 $10.4 $45.7 $10.6
TLGP — — 10.5 — 9.8 —
FHLB borrowings 11.8 9.5 2.7 8.0 13.0 6.0
Securitizations 2.4 11.5 25.2 0.5 16.1 0.7
Local Country and Other 3.6 2.7 3.9 1.9 6.8 3.9
Total $63.8 $54.4 $ 117.6 $27.7 $89.0 $31.0
(1) 2013 maturities include buybacks and the redemption via exchange of approximately $3.0 billion of trust preferred securities previously held by the U.S. Treasury and FDIC. Issuance includes the exchange of these
trust preferred securities for approximately $3.3 billion of subordinated debt.