Citibank 2013 Annual Report Download - page 214
Download and view the complete annual report
Please find page 214 of the 2013 Citibank annual report below. You can navigate through the pages in the report by either clicking on the pages listed below, or by using the keyword search tool below to find specific information within the annual report.-
 1
1 -
2
-
3
-
4
-
5
-
6
-
7
-
8
-
9
-
10
-
11
-
12
-
13
-
14
-
15
-
16
-
17
-
18
-
19
-
20
-
21
-
22
-
23
-
24
-
25
-
26
-
27
-
28
-
29
-
30
-
31
-
32
-
33
-
34
-
35
-
36
-
37
-
38
-
39
-
40
-
41
-
42
-
43
-
44
-
45
-
46
-
47
-
48
-
49
-
50
-
51
-
52
-
53
-
54
-
55
-
56
-
57
-
58
-
59
-
60
-
61
-
62
-
63
-
64
-
65
-
66
-
67
-
68
-
69
-
70
-
71
-
72
-
73
-
74
-
75
-
76
-
77
-
78
-
79
-
80
-
81
-
82
-
83
-
84
-
85
-
86
-
87
-
88
-
89
-
90
-
91
-
92
-
93
-
94
-
95
-
96
-
97
-
98
-
99
-
100
-
101
-
102
-
103
-
104
-
105
-
106
-
107
-
108
-
109
-
110
-
111
-
112
-
113
-
114
-
115
-
116
-
117
-
118
-
119
-
120
-
121
-
122
-
123
-
124
-
125
-
126
-
127
-
128
-
129
-
130
-
131
-
132
-
133
-
134
-
135
-
136
-
137
-
138
-
139
-
140
-
141
-
142
-
143
-
144
-
145
-
146
-
147
-
148
-
149
-
150
-
151
-
152
-
153
-
154
-
155
-
156
-
157
-
158
-
159
-
160
-
161
-
162
-
163
-
164
-
165
-
166
-
167
-
168
-
169
-
170
-
171
-
172
-
173
-
174
-
175
-
176
-
177
-
178
-
179
-
180
-
181
-
182
-
183
-
184
-
185
-
186
-
187
-
188
-
189
-
190
-
191
-
192
-
193
-
194
-
195
-
196
-
197
-
198
-
199
-
200
-
201
-
202
-
203
-
 204
204 -
 205
205 -
 206
206 -
 207
207 -
 208
208 -
 209
209 -
 210
210 -
 211
211 -
 212
212 -
 213
213 -
 214
214 -
 215
215 -
 216
216 -
 217
217 -
 218
218 -
 219
219 -
 220
220 -
 221
221 -
 222
222 -
 223
223 -
 224
224 -
225
-
226
-
227
-
228
-
229
-
230
-
231
-
232
-
233
-
234
-
235
-
236
-
237
-
238
-
239
-
240
-
241
-
242
-
243
-
244
-
245
-
246
-
247
-
248
-
249
-
250
-
251
-
252
-
253
-
254
-
255
-
256
-
257
-
258
-
259
-
260
-
261
-
262
-
263
-
264
-
265
-
266
-
267
-
268
-
269
-
270
-
271
-
272
-
273
-
274
-
275
-
276
-
277
-
278
-
279
-
280
-
281
-
282
-
283
-
284
-
285
-
286
-
287
-
288
-
289
-
290
-
291
-
292
-
293
-
294
-
295
-
296
-
297
-
298
-
299
-
300
-
301
-
302
-
303
-
304
-
305
-
306
-
307
-
308
-
309
-
310
-
311
-
312
-
313
-
314
-
315
-
316
-
317
-
318
-
319
-
320
-
321
-
322
-
323
-
324
-
325
-
326
-
327
-
328
-
329
-
330
-
331
-
332
-
333
-
334
-
335
-
336
-
337
-
338
-
339
-
340
-
341
-
342
 |
 |

196
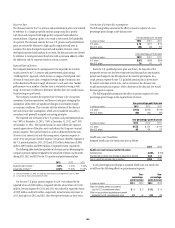
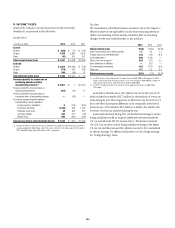
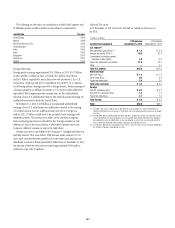
Deferred Income Taxes
Deferred income taxes at December 31 related to the following:
In millions of dollars 2013 2012
Deferred tax assets
Credit loss deduction $ 8,356 $10,947
Deferred compensation and employee benefits 4,067 4,890
Restructuring and settlement reserves 1,806 1,645
Unremitted foreign earnings 6,910 5,114
Investment and loan basis differences 4,409 3,878
Cash flow hedges 736 1,361
Tax credit and net operating loss carry-forwards 26,097 28,087
Fixed assets and leases 666 —
Debt Issuances —614
Other deferred tax assets 2,734 1,964
Gross deferred tax assets $55,781 $58,500
Valuation allowance ——
Deferred tax assets after valuation allowance $55,781 $58,500
Deferred tax liabilities
Deferred policy acquisition costs
and value of insurance in force $ (455) $ (495)
Fixed assets and leases —(623)
Intangibles (1,076) (1,517)
Debt issuances (811) —
Other deferred tax liabilities (640) (543)
Gross deferred tax liabilities $ (2,982) $ (3,178)
Net deferred tax assets $52,799 $55,322
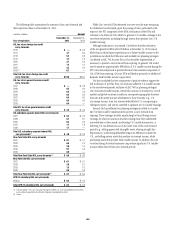
Unrecognized Tax Benefits
The following is a roll-forward of the Company’s unrecognized tax benefits.
In millions of dollars 2013 2012 2011
Total unrecognized tax benefits at January 1 $ 3,109 $ 3,923 $4,035
Net amount of increases for current year’s tax positions 58 136 193
Gross amount of increases for prior years’ tax positions 251 345 251
Gross amount of decreases for prior years’ tax positions (716) (1,246) (507)
Amounts of decreases relating to settlements (1,115) (44) (11)
Reductions due to lapse of statutes of limitation (15) (3) (38)
Foreign exchange, acquisitions and dispositions 2(2) —
Total unrecognized tax benefits at December 31 $ 1,574 $ 3,109 $3,923
The total amounts of unrecognized tax benefits at December 31, 2013,
2012 and 2011 that, if recognized, would affect Citi’s effective tax rate,
are $0.8 billion, $1.3 billion and $2.2 billion, respectively. The remaining
uncertain tax positions have offsetting amounts in other jurisdictions or are
temporary differences, except for $0.4 billion at December 31, 2013, which
would be booked directly to Retained earnings.
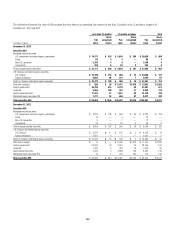
Interest and penalties (not included in “unrecognized tax benefits”
above) are a component of the Provision for income taxes.
2013 2012 2011
In millions of dollars Pretax Net of tax Pretax Net of tax Pretax Net of tax
Total interest and penalties in the Consolidated Balance Sheet at January 1 $492 $315 $404 $261 $ 348 $ 223
Total interest and penalties in the Consolidated Statement of Income (108) (72) 114 71 61 41
Total interest and penalties in the Consolidated Balance Sheet at December 31 (1) 277 173 492 315 404 261
(1) Includes $2 million, $10 million and $14 million for foreign penalties in 2013, 2012 and 2011, respectively. Also includes $4 million for state penalties in 2013, 2012 and 2011.
Citi currently is under audit by the Internal Revenue Service and other
major taxing jurisdictions around the world. It is thus reasonably possible
that significant changes in the gross balance of unrecognized tax benefits
may occur within the next 12 months, although Citi does not expect such
audits to result in amounts that would cause a significant change to its
effective tax rate, other than as discussed below.
Citi expects to conclude its IRS audit for the 2009-2011 cycle within the
next 12 months. The gross uncertain tax positions at December 31, 2013 for
the items that may be resolved are as much as $520 million. Because of the
number and nature of the issues remaining to be resolved, the potential tax
benefit to continuing operations could be anywhere from $0 to $150 million,
while the potential tax benefit to retained earnings could be from $0 to
$350 million. In addition, Citi may conclude certain state and local tax
audits within the next 12 months. The gross uncertain tax positions at
December 31, 2013 are as much as $170 million. The potential tax benefit
to continuing operations could be anywhere between $0 and $110 million,
excluding interest.