Citibank 2013 Annual Report Download - page 104
Download and view the complete annual report
Please find page 104 of the 2013 Citibank annual report below. You can navigate through the pages in the report by either clicking on the pages listed below, or by using the keyword search tool below to find specific information within the annual report.-
 1
1 -
2
-
3
-
4
-
5
-
6
-
7
-
8
-
9
-
10
-
11
-
12
-
13
-
14
-
15
-
16
-
17
-
18
-
19
-
20
-
21
-
22
-
23
-
24
-
25
-
26
-
27
-
28
-
29
-
30
-
31
-
32
-
33
-
34
-
35
-
36
-
37
-
38
-
39
-
40
-
41
-
42
-
43
-
44
-
45
-
46
-
47
-
48
-
49
-
50
-
51
-
52
-
53
-
54
-
55
-
56
-
57
-
58
-
59
-
60
-
61
-
62
-
63
-
64
-
65
-
66
-
67
-
68
-
69
-
70
-
71
-
72
-
73
-
74
-
75
-
76
-
77
-
78
-
79
-
80
-
81
-
82
-
83
-
84
-
85
-
86
-
87
-
88
-
89
-
90
-
91
-
92
-
93
-
 94
94 -
 95
95 -
 96
96 -
 97
97 -
 98
98 -
 99
99 -
 100
100 -
 101
101 -
 102
102 -
 103
103 -
 104
104 -
 105
105 -
 106
106 -
 107
107 -
 108
108 -
 109
109 -
 110
110 -
 111
111 -
 112
112 -
 113
113 -
 114
114 -
115
-
116
-
117
-
118
-
119
-
120
-
121
-
122
-
123
-
124
-
125
-
126
-
127
-
128
-
129
-
130
-
131
-
132
-
133
-
134
-
135
-
136
-
137
-
138
-
139
-
140
-
141
-
142
-
143
-
144
-
145
-
146
-
147
-
148
-
149
-
150
-
151
-
152
-
153
-
154
-
155
-
156
-
157
-
158
-
159
-
160
-
161
-
162
-
163
-
164
-
165
-
166
-
167
-
168
-
169
-
170
-
171
-
172
-
173
-
174
-
175
-
176
-
177
-
178
-
179
-
180
-
181
-
182
-
183
-
184
-
185
-
186
-
187
-
188
-
189
-
190
-
191
-
192
-
193
-
194
-
195
-
196
-
197
-
198
-
199
-
200
-
201
-
202
-
203
-
204
-
205
-
206
-
207
-
208
-
209
-
210
-
211
-
212
-
213
-
214
-
215
-
216
-
217
-
218
-
219
-
220
-
221
-
222
-
223
-
224
-
225
-
226
-
227
-
228
-
229
-
230
-
231
-
232
-
233
-
234
-
235
-
236
-
237
-
238
-
239
-
240
-
241
-
242
-
243
-
244
-
245
-
246
-
247
-
248
-
249
-
250
-
251
-
252
-
253
-
254
-
255
-
256
-
257
-
258
-
259
-
260
-
261
-
262
-
263
-
264
-
265
-
266
-
267
-
268
-
269
-
270
-
271
-
272
-
273
-
274
-
275
-
276
-
277
-
278
-
279
-
280
-
281
-
282
-
283
-
284
-
285
-
286
-
287
-
288
-
289
-
290
-
291
-
292
-
293
-
294
-
295
-
296
-
297
-
298
-
299
-
300
-
301
-
302
-
303
-
304
-
305
-
306
-
307
-
308
-
309
-
310
-
311
-
312
-
313
-
314
-
315
-
316
-
317
-
318
-
319
-
320
-
321
-
322
-
323
-
324
-
325
-
326
-
327
-
328
-
329
-
330
-
331
-
332
-
333
-
334
-
335
-
336
-
337
-
338
-
339
-
340
-
341
-
342
 |
 |
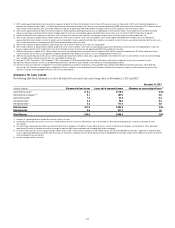
86
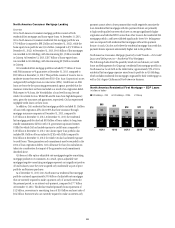
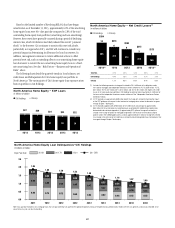
North America Consumer Mortgage Quarterly Credit Trends—Net Credit
Losses and Delinquencies—Home Equity Loans
Citi’s home equity loan portfolio consists of both fixed-rate home equity
loans and loans extended under home equity lines of credit. Fixed-rate
home equity loans are fully amortizing. Home equity lines of credit allow
for amounts to be drawn for a period of time with the payment of interest
only and then, at the end of the draw period, the then-outstanding amount
is converted to an amortizing loan (the interest-only payment feature during
the revolving period is standard for this product across the industry). Prior
to June 2010, Citi’s originations of home equity lines of credit typically had
a 10-year draw period. Beginning in June 2010, Citi’s originations of home
equity lines of credit typically have a five-year draw period as Citi changed
these terms to mitigate risk. After conversion, the home equity loans typically
have a 20-year amortization period.
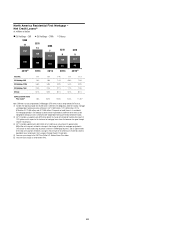
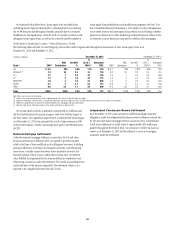
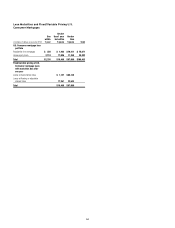
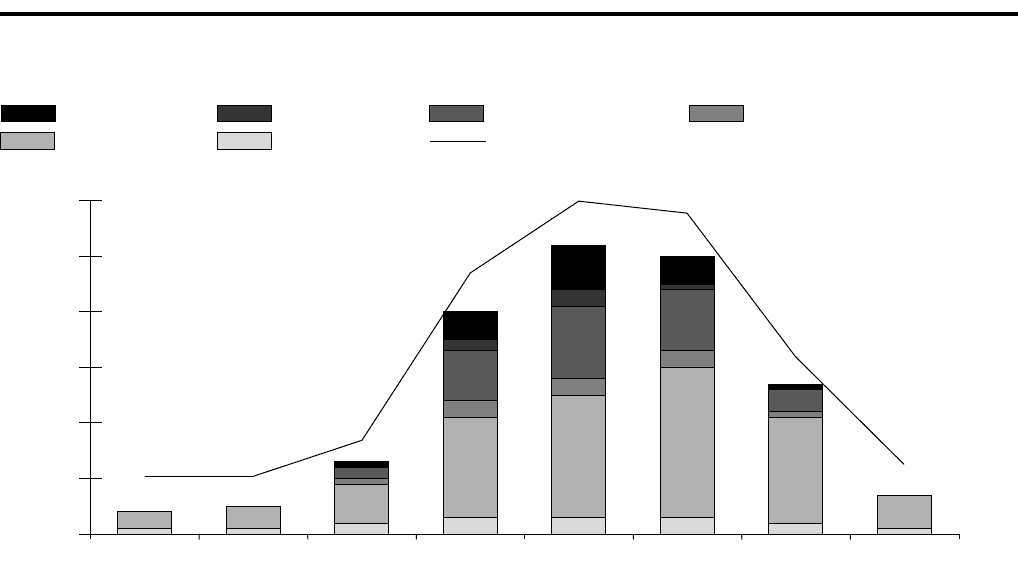
At December 31, 2013, Citi’s home equity loan portfolio of $31.6 billion
included approximately $18.9 billion of home equity lines of credit
(Revolving HELOCs) that are still within their revolving period and have
not commenced amortization, or “reset,” compared to $22.0 billion at
December 31, 2012. The following chart sets forth these Revolving HELOCs
(based on certain FICO and combined loan-to-value (CLTV) characteristics
of the portfolio) and the year in which they reset:
FICO 660+,CLTV>100 FICO<660,CLTV>100 FICO 660+,CLTV>=80<=100 FICO<660,CLTV>=80<=100
FICO 660+,CLTV<80 FICO<660,CLTV<80 %ENR
$6.0
$5.0
$4.0
$3.0
$2.0
$1.0
$0.0
2019+201820172016201520142013Pre 2013
$0.5
3%
$0.5
3% $1.2
6%
$4.0
20%
$5.2
26%
$5.1
25%
$2.7
13%
$0.8
4%
North America Home Equity Lines of Credit Amortization—Citigroup
Total Ending Net Receivables (ENR) by Reset Year
In billions of dollars as of December 31, 2013
Note: Totals may not sum due to rounding.
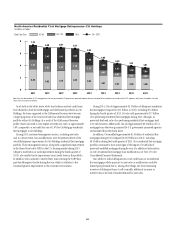
As indicated by the chart above, approximately 6% of Citi’s Revolving
HELOCs had commenced amortization as of December 31, 2013, compared
to approximately 6% and 72% that will commence amortization during
2014 and 2015-2017, respectively. Before commencing amortization,
Revolving HELOC borrowers are required to pay only interest on their loans.
Upon amortization, these borrowers will be required to pay both interest,
typically at a variable rate, and principal that amortizes over 20 years,
rather than the typical 30-year amortization. As a result, Citi’s customers
with Revolving HELOCs that reset could experience “payment shock” due to
the higher required payments on the loans. While it is not certain what, if
any, impact this payment shock could have on Citi’s delinquency rates and
net credit losses, Citi currently estimates the monthly loan payment for its
Revolving HELOCs that reset during 2015-2017 could increase on average
by approximately $360 or 170%. Increases in interest rates could further
increase these payments given the variable nature of the interest rates on
these loans post-reset.