Citibank 2013 Annual Report Download - page 313
Download and view the complete annual report
Please find page 313 of the 2013 Citibank annual report below. You can navigate through the pages in the report by either clicking on the pages listed below, or by using the keyword search tool below to find specific information within the annual report.-
 1
1 -
2
-
3
-
4
-
5
-
6
-
7
-
8
-
9
-
10
-
11
-
12
-
13
-
14
-
15
-
16
-
17
-
18
-
19
-
20
-
21
-
22
-
23
-
24
-
25
-
26
-
27
-
28
-
29
-
30
-
31
-
32
-
33
-
34
-
35
-
36
-
37
-
38
-
39
-
40
-
41
-
42
-
43
-
44
-
45
-
46
-
47
-
48
-
49
-
50
-
51
-
52
-
53
-
54
-
55
-
56
-
57
-
58
-
59
-
60
-
61
-
62
-
63
-
64
-
65
-
66
-
67
-
68
-
69
-
70
-
71
-
72
-
73
-
74
-
75
-
76
-
77
-
78
-
79
-
80
-
81
-
82
-
83
-
84
-
85
-
86
-
87
-
88
-
89
-
90
-
91
-
92
-
93
-
94
-
95
-
96
-
97
-
98
-
99
-
100
-
101
-
102
-
103
-
104
-
105
-
106
-
107
-
108
-
109
-
110
-
111
-
112
-
113
-
114
-
115
-
116
-
117
-
118
-
119
-
120
-
121
-
122
-
123
-
124
-
125
-
126
-
127
-
128
-
129
-
130
-
131
-
132
-
133
-
134
-
135
-
136
-
137
-
138
-
139
-
140
-
141
-
142
-
143
-
144
-
145
-
146
-
147
-
148
-
149
-
150
-
151
-
152
-
153
-
154
-
155
-
156
-
157
-
158
-
159
-
160
-
161
-
162
-
163
-
164
-
165
-
166
-
167
-
168
-
169
-
170
-
171
-
172
-
173
-
174
-
175
-
176
-
177
-
178
-
179
-
180
-
181
-
182
-
183
-
184
-
185
-
186
-
187
-
188
-
189
-
190
-
191
-
192
-
193
-
194
-
195
-
196
-
197
-
198
-
199
-
200
-
201
-
202
-
203
-
204
-
205
-
206
-
207
-
208
-
209
-
210
-
211
-
212
-
213
-
214
-
215
-
216
-
217
-
218
-
219
-
220
-
221
-
222
-
223
-
224
-
225
-
226
-
227
-
228
-
229
-
230
-
231
-
232
-
233
-
234
-
235
-
236
-
237
-
238
-
239
-
240
-
241
-
242
-
243
-
244
-
245
-
246
-
247
-
248
-
249
-
250
-
251
-
252
-
253
-
254
-
255
-
256
-
257
-
258
-
259
-
260
-
261
-
262
-
263
-
264
-
265
-
266
-
267
-
268
-
269
-
270
-
271
-
272
-
273
-
274
-
275
-
276
-
277
-
278
-
279
-
280
-
281
-
282
-
283
-
284
-
285
-
286
-
287
-
288
-
289
-
290
-
291
-
292
-
293
-
294
-
295
-
296
-
297
-
298
-
299
-
300
-
301
-
302
-
 303
303 -
 304
304 -
 305
305 -
 306
306 -
 307
307 -
 308
308 -
 309
309 -
 310
310 -
 311
311 -
 312
312 -
 313
313 -
 314
314 -
 315
315 -
 316
316 -
 317
317 -
 318
318 -
 319
319 -
 320
320 -
 321
321 -
 322
322 -
 323
323 -
324
-
325
-
326
-
327
-
328
-
329
-
330
-
331
-
332
-
333
-
334
-
335
-
336
-
337
-
338
-
339
-
340
-
341
-
342
 |
 |

295
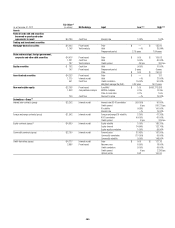
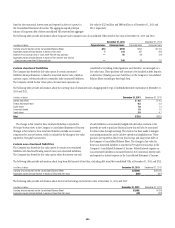
based on the contractual interest rates and reported as Interest expense in
the Consolidated Statement of Income. The aggregate unpaid principal
balance of long-term debt of these consolidated VIEs exceeded the aggregate
fair value by $223 million and $869 million as of December 31, 2013 and
2012, respectively.
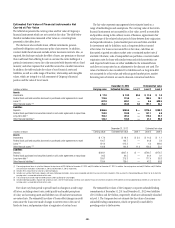
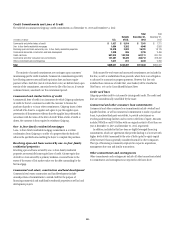
The following table provides information about Corporate and Consumer loans of consolidated VIEs carried at fair value at December 31, 2013 and 2012:
December 31, 2013 December 31, 2012
In millions of dollars Corporate loans Consumer loans Corporate loans Consumer loans
Carrying amount reported on the Consolidated Balance Sheet $14 $ 910 $157 $1,191
Aggregate unpaid principal balance in excess of fair value 7 212 347 293
Balance of non-accrual loans or loans more than 90 days past due — 81 34 123
Aggregate unpaid principal balance in excess of fair value for non-accrual
loans or loans more than 90 days past due — 106 36 111
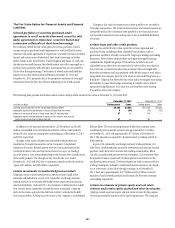
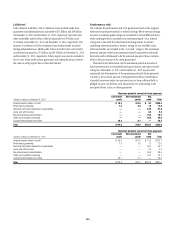
Certain structured liabilities
The Company has elected the fair value option for certain structured
liabilities whose performance is linked to structured interest rates, inflation,
currency, equity, referenced credit or commodity risks (structured liabilities).
The Company elected the fair value option, because these exposures are
considered to be trading-related positions and, therefore, are managed on a
fair value basis. These positions will continue to be classified as debt, deposits
or derivatives (Trading account liabilities) on the Company’s Consolidated
Balance Sheet according to their legal form.
The following table provides information about the carrying value of structured notes, disaggregated by type of embedded derivative instrument at December 31,
2013 and 2012:
In billions of dollars December 31, 2013 December 31, 2012
Interest rate linked $ 9.8 $ 9.9
Foreign exchange linked 0.5 0.9
Equity linked 7.0 7.3
Commodity linked 1.8 1.0
Credit linked 3.5 4.7
Total $22.6 $23.8
The change in fair value for these structured liabilities is reported in
Principal transactions in the Company’s Consolidated Statement of Income.
Changes in fair value for these structured liabilities include an economic
component for accrued interest, which is included in the change in fair value
reported in Principal transactions.
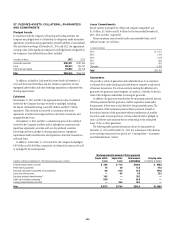
Certain non-structured liabilities
The Company has elected the fair value option for certain non-structured
liabilities with fixed and floating interest rates (non-structured liabilities).
The Company has elected the fair value option where the interest-rate risk
of such liabilities is economically hedged with derivative contracts or the
proceeds are used to purchase financial assets that will also be accounted
for at fair value through earnings. The election has been made to mitigate
accounting mismatches and to achieve operational simplifications. These
positions are reported in Short-term borrowings and Long-term debt on
the Company’s Consolidated Balance Sheet. The change in fair value for
these non-structured liabilities is reported in Principal transactions in the
Company’s Consolidated Statement of Income. Related interest expense on
non-structured liabilities is measured based on the contractual interest rates
and reported as Interest expense in the Consolidated Statement of Income.
The following table provides information about long-term debt carried at fair value, excluding debt issued by consolidated VIEs, at December 31, 2013 and 2012:
In millions of dollars December 31, 2013 December 31, 2012
Carrying amount reported on the Consolidated Balance Sheet $25,968 $28,434
Aggregate unpaid principal balance in excess of (less than) fair value (866) (807)
The following table provides information about short-term borrowings carried at fair value at December 31, 2013 and 2012:
In millions of dollars December 31, 2013 December 31, 2012
Carrying amount reported on the Consolidated Balance Sheet $3,692 $ 818
Aggregate unpaid principal balance in excess of (less than) fair value (38) (232)