Citibank 2013 Annual Report Download - page 193
Download and view the complete annual report
Please find page 193 of the 2013 Citibank annual report below. You can navigate through the pages in the report by either clicking on the pages listed below, or by using the keyword search tool below to find specific information within the annual report.-
 1
1 -
2
-
3
-
4
-
5
-
6
-
7
-
8
-
9
-
10
-
11
-
12
-
13
-
14
-
15
-
16
-
17
-
18
-
19
-
20
-
21
-
22
-
23
-
24
-
25
-
26
-
27
-
28
-
29
-
30
-
31
-
32
-
33
-
34
-
35
-
36
-
37
-
38
-
39
-
40
-
41
-
42
-
43
-
44
-
45
-
46
-
47
-
48
-
49
-
50
-
51
-
52
-
53
-
54
-
55
-
56
-
57
-
58
-
59
-
60
-
61
-
62
-
63
-
64
-
65
-
66
-
67
-
68
-
69
-
70
-
71
-
72
-
73
-
74
-
75
-
76
-
77
-
78
-
79
-
80
-
81
-
82
-
83
-
84
-
85
-
86
-
87
-
88
-
89
-
90
-
91
-
92
-
93
-
94
-
95
-
96
-
97
-
98
-
99
-
100
-
101
-
102
-
103
-
104
-
105
-
106
-
107
-
108
-
109
-
110
-
111
-
112
-
113
-
114
-
115
-
116
-
117
-
118
-
119
-
120
-
121
-
122
-
123
-
124
-
125
-
126
-
127
-
128
-
129
-
130
-
131
-
132
-
133
-
134
-
135
-
136
-
137
-
138
-
139
-
140
-
141
-
142
-
143
-
144
-
145
-
146
-
147
-
148
-
149
-
150
-
151
-
152
-
153
-
154
-
155
-
156
-
157
-
158
-
159
-
160
-
161
-
162
-
163
-
164
-
165
-
166
-
167
-
168
-
169
-
170
-
171
-
172
-
173
-
174
-
175
-
176
-
177
-
178
-
179
-
180
-
181
-
182
-
 183
183 -
 184
184 -
 185
185 -
 186
186 -
 187
187 -
 188
188 -
 189
189 -
 190
190 -
 191
191 -
 192
192 -
 193
193 -
 194
194 -
 195
195 -
 196
196 -
 197
197 -
 198
198 -
 199
199 -
 200
200 -
 201
201 -
 202
202 -
 203
203 -
204
-
205
-
206
-
207
-
208
-
209
-
210
-
211
-
212
-
213
-
214
-
215
-
216
-
217
-
218
-
219
-
220
-
221
-
222
-
223
-
224
-
225
-
226
-
227
-
228
-
229
-
230
-
231
-
232
-
233
-
234
-
235
-
236
-
237
-
238
-
239
-
240
-
241
-
242
-
243
-
244
-
245
-
246
-
247
-
248
-
249
-
250
-
251
-
252
-
253
-
254
-
255
-
256
-
257
-
258
-
259
-
260
-
261
-
262
-
263
-
264
-
265
-
266
-
267
-
268
-
269
-
270
-
271
-
272
-
273
-
274
-
275
-
276
-
277
-
278
-
279
-
280
-
281
-
282
-
283
-
284
-
285
-
286
-
287
-
288
-
289
-
290
-
291
-
292
-
293
-
294
-
295
-
296
-
297
-
298
-
299
-
300
-
301
-
302
-
303
-
304
-
305
-
306
-
307
-
308
-
309
-
310
-
311
-
312
-
313
-
314
-
315
-
316
-
317
-
318
-
319
-
320
-
321
-
322
-
323
-
324
-
325
-
326
-
327
-
328
-
329
-
330
-
331
-
332
-
333
-
334
-
335
-
336
-
337
-
338
-
339
-
340
-
341
-
342
 |
 |

175
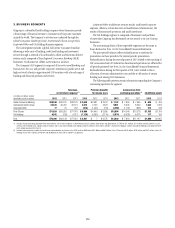
6. PRINCIPAL TRANSACTIONS
Principal transactions revenue consists of realized and unrealized gains
and losses from trading activities. Trading activities include revenues
from fixed income, equities, credit and commodities products, and foreign
exchange transactions. Not included in the table below is the impact of
net interest revenue related to trading activities, which is an integral part
of trading activities’ profitability. See Note 4 to the Consolidated Financial
Statements for information about net interest revenue related to trading
activity. Principal transactions include CVA (credit valuation adjustment on
derivatives) and DVA (debt valuation adjustments on issued liabilities, for
which the fair value option has been elected).
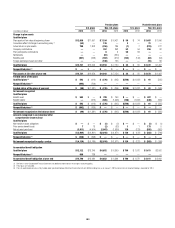
The following table presents principal transactions revenue for the years
ended December 31:
In millions of dollars 2013 2012 2011
Global Consumer Banking $ 863 $812 $ 716
Institutional Clients Group 6,310 4,130 4,873
Corporate/Other (76) (192 ) 45
Subtotal Citicorp $ 7,097 $ 4,750 $ 5,634
Citi Holdings 24 31 1,600
Total Citigroup $7,121 $ 4,781 $ 7,234
Interest rate contracts (1) $ 3,978 $ 2,301 $ 5,136
Foreign exchange contracts (2) 2,224 2,403 2,309
Equity contracts (3) 319 158 3
Commodity and other contracts (4) 267 92 76
Credit derivatives (5) 333 (173 ) (290)
Total $ 7,121 $ 4,781 $ 7,234
(1) Includes revenues from government securities and corporate debt, municipal securities, preferred
stock, mortgage securities and other debt instruments. Also includes spot and forward trading of
currencies and exchange-traded and over-the-counter (OTC) currency options, options on fixed
income securities, interest rate swaps, currency swaps, swap options, caps and floors, financial
futures, OTC options and forward contracts on fixed income securities.
(2) Includes revenues from foreign exchange spot, forward, option and swap contracts, as well as FX
translation gains and losses.
(3) Includes revenues from common, preferred and convertible preferred stock, convertible corporate
debt, equity-linked notes and exchange-traded and OTC equity options and warrants.
(4) Primarily includes revenues from crude oil, refined oil products, natural gas and other
commodities trades.
(5) Includes revenues from structured credit products.
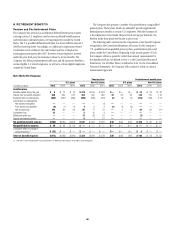
7. INCENTIVE PLANS
Overview
The Company makes restricted or deferred stock and/or deferred cash awards,
as well as stock payments, as part of its discretionary annual incentive award
program involving a large segment of Citigroup’s employees worldwide.
Stock awards, deferred cash awards and grants of stock options also may
be made at various times during the year as sign-on awards to induce new
hires to join the Company or to high-potential employees as long-term
retention awards.
Consistent with long-standing practice, a portion of annual compensation
for non-employee directors also is delivered in the form of equity awards.
Other incentive awards are made on an annual or other regular basis
pursuant to programs designed to retain and motivate certain employees
who do not participate in Citigroup’s annual discretionary incentive award
program.
Recipients of Citigroup stock awards generally do not have any
stockholder rights until shares are delivered upon vesting or exercise, or after
the expiration of applicable required holding periods. Recipients of restricted
or deferred stock awards, however, may be entitled to receive dividends
or dividend-equivalent payments during the vesting period. Recipients
of restricted stock awards generally are entitled to vote the shares in their
award during the vesting period. Once a stock award vests, the shares are
freely transferable, unless they are subject to a restriction on sale or transfer
for a specified period. Pursuant to a stock ownership commitment, certain
executives have committed to holding most of their vested shares indefinitely.
All equity awards granted since April 19, 2005 have been made pursuant
to stockholder-approved stock incentive plans that are administered by the
Personnel and Compensation Committee of the Citigroup Board of Directors
(the Committee), which is composed entirely of independent non-employee
directors.
At December 31, 2013, approximately 68.4 million shares of Citigroup
common stock were authorized and available for grant under Citigroup’s
2009 Stock Incentive Plan, the only plan from which equity awards are
currently granted.
The 2009 Stock Incentive Plan and predecessor plans permit the use of
treasury stock or newly issued shares in connection with awards granted
under the plans. Newly issued shares were issued to settle the vesting of
annual deferred stock awards in January 2011, 2012, 2013 and 2014. The
newly issued shares in January 2011 were specifically intended to increase
the Company’s equity capital. The use of treasury stock or newly issued
shares to settle stock awards does not affect the amortization recorded in the
Consolidated Income Statement for equity awards.