Citibank 2013 Annual Report Download - page 67
Download and view the complete annual report
Please find page 67 of the 2013 Citibank annual report below. You can navigate through the pages in the report by either clicking on the pages listed below, or by using the keyword search tool below to find specific information within the annual report.-
 1
1 -
2
-
3
-
4
-
5
-
6
-
7
-
8
-
9
-
10
-
11
-
12
-
13
-
14
-
15
-
16
-
17
-
18
-
19
-
20
-
21
-
22
-
23
-
24
-
25
-
26
-
27
-
28
-
29
-
30
-
31
-
32
-
33
-
34
-
35
-
36
-
37
-
38
-
39
-
40
-
41
-
42
-
43
-
44
-
45
-
46
-
47
-
48
-
49
-
50
-
51
-
52
-
53
-
54
-
55
-
56
-
 57
57 -
 58
58 -
 59
59 -
 60
60 -
 61
61 -
 62
62 -
 63
63 -
 64
64 -
 65
65 -
 66
66 -
 67
67 -
 68
68 -
 69
69 -
 70
70 -
 71
71 -
 72
72 -
 73
73 -
 74
74 -
 75
75 -
 76
76 -
 77
77 -
78
-
79
-
80
-
81
-
82
-
83
-
84
-
85
-
86
-
87
-
88
-
89
-
90
-
91
-
92
-
93
-
94
-
95
-
96
-
97
-
98
-
99
-
100
-
101
-
102
-
103
-
104
-
105
-
106
-
107
-
108
-
109
-
110
-
111
-
112
-
113
-
114
-
115
-
116
-
117
-
118
-
119
-
120
-
121
-
122
-
123
-
124
-
125
-
126
-
127
-
128
-
129
-
130
-
131
-
132
-
133
-
134
-
135
-
136
-
137
-
138
-
139
-
140
-
141
-
142
-
143
-
144
-
145
-
146
-
147
-
148
-
149
-
150
-
151
-
152
-
153
-
154
-
155
-
156
-
157
-
158
-
159
-
160
-
161
-
162
-
163
-
164
-
165
-
166
-
167
-
168
-
169
-
170
-
171
-
172
-
173
-
174
-
175
-
176
-
177
-
178
-
179
-
180
-
181
-
182
-
183
-
184
-
185
-
186
-
187
-
188
-
189
-
190
-
191
-
192
-
193
-
194
-
195
-
196
-
197
-
198
-
199
-
200
-
201
-
202
-
203
-
204
-
205
-
206
-
207
-
208
-
209
-
210
-
211
-
212
-
213
-
214
-
215
-
216
-
217
-
218
-
219
-
220
-
221
-
222
-
223
-
224
-
225
-
226
-
227
-
228
-
229
-
230
-
231
-
232
-
233
-
234
-
235
-
236
-
237
-
238
-
239
-
240
-
241
-
242
-
243
-
244
-
245
-
246
-
247
-
248
-
249
-
250
-
251
-
252
-
253
-
254
-
255
-
256
-
257
-
258
-
259
-
260
-
261
-
262
-
263
-
264
-
265
-
266
-
267
-
268
-
269
-
270
-
271
-
272
-
273
-
274
-
275
-
276
-
277
-
278
-
279
-
280
-
281
-
282
-
283
-
284
-
285
-
286
-
287
-
288
-
289
-
290
-
291
-
292
-
293
-
294
-
295
-
296
-
297
-
298
-
299
-
300
-
301
-
302
-
303
-
304
-
305
-
306
-
307
-
308
-
309
-
310
-
311
-
312
-
313
-
314
-
315
-
316
-
317
-
318
-
319
-
320
-
321
-
322
-
323
-
324
-
325
-
326
-
327
-
328
-
329
-
330
-
331
-
332
-
333
-
334
-
335
-
336
-
337
-
338
-
339
-
340
-
341
-
342
 |
 |
49
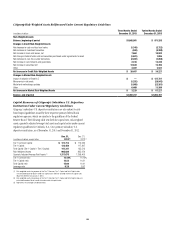
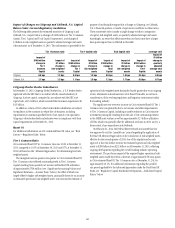
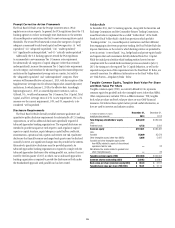
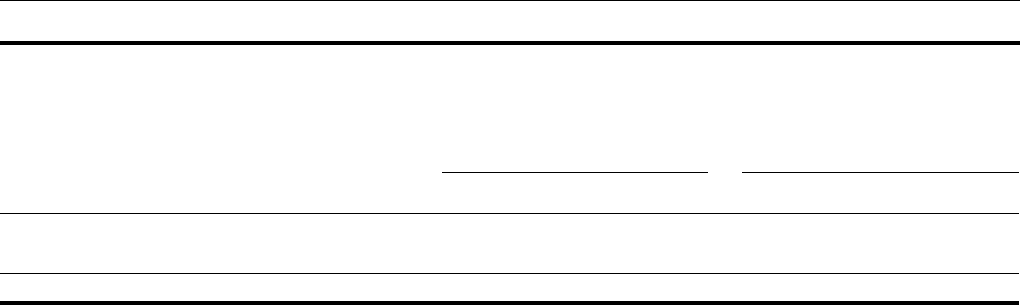
Citigroup Risk-Weighted Assets Under Basel III
In millions of dollars
December 31,
2013 (1)
December 31,
2012 (2)
Advanced Approaches total risk-weighted assets $ 1,186,000 $ 1,206,000
Standardized Approach total risk-weighted assets $ 1,177,000 $ 1,200,000
(1) Calculated based on the Final Basel III Rules, and with full implementation assumed.
(2) Calculated based on the proposed U.S. Basel III rules, and with full implementation assumed.
Citigroup Risk-Weighted Assets Under Basel III at December 31, 2013 (1)
Advanced Approaches Standardized Approach
In millions of dollars Citicorp
Citi
Holdings Total Citicorp
Citi
Holdings Total
Credit Risk $693,000 $ 149,000 $ 842,000 $ 963,000 $ 102,000 $1,065,000
Market Risk 107,000 5,000 112,000 107,000 5,000 112,000
Operational Risk (2)(3) 160,000 72,000 232,000 — — —
Total $960,000 $ 226,000 $1,186,000 $1,070,000 $ 107,000 $1,177,000
(1) Calculated based on the Final Basel III Rules, and with full implementation assumed.
(2) Given that operational risk is measured based not only upon Citi’s historical loss experience but also is reflective of ongoing events in the banking industry, efforts at reducing assets and exposures should result mostly
in reductions in credit and market risk-weighted assets.
(3) As noted under “Basel III - Tier 1 Common Ratio” above, Citi will be required to increase its estimated operational risk-weighted assets from $232 billion at December 31, 2013 to $288 billion in connection with Citi’s
exit from the “parallel run” period regarding the application of the Basel III Advanced Approaches in the calculation of risk-weighted assets.