Citibank 2013 Annual Report Download - page 235
Download and view the complete annual report
Please find page 235 of the 2013 Citibank annual report below. You can navigate through the pages in the report by either clicking on the pages listed below, or by using the keyword search tool below to find specific information within the annual report.-
 1
1 -
2
-
3
-
4
-
5
-
6
-
7
-
8
-
9
-
10
-
11
-
12
-
13
-
14
-
15
-
16
-
17
-
18
-
19
-
20
-
21
-
22
-
23
-
24
-
25
-
26
-
27
-
28
-
29
-
30
-
31
-
32
-
33
-
34
-
35
-
36
-
37
-
38
-
39
-
40
-
41
-
42
-
43
-
44
-
45
-
46
-
47
-
48
-
49
-
50
-
51
-
52
-
53
-
54
-
55
-
56
-
57
-
58
-
59
-
60
-
61
-
62
-
63
-
64
-
65
-
66
-
67
-
68
-
69
-
70
-
71
-
72
-
73
-
74
-
75
-
76
-
77
-
78
-
79
-
80
-
81
-
82
-
83
-
84
-
85
-
86
-
87
-
88
-
89
-
90
-
91
-
92
-
93
-
94
-
95
-
96
-
97
-
98
-
99
-
100
-
101
-
102
-
103
-
104
-
105
-
106
-
107
-
108
-
109
-
110
-
111
-
112
-
113
-
114
-
115
-
116
-
117
-
118
-
119
-
120
-
121
-
122
-
123
-
124
-
125
-
126
-
127
-
128
-
129
-
130
-
131
-
132
-
133
-
134
-
135
-
136
-
137
-
138
-
139
-
140
-
141
-
142
-
143
-
144
-
145
-
146
-
147
-
148
-
149
-
150
-
151
-
152
-
153
-
154
-
155
-
156
-
157
-
158
-
159
-
160
-
161
-
162
-
163
-
164
-
165
-
166
-
167
-
168
-
169
-
170
-
171
-
172
-
173
-
174
-
175
-
176
-
177
-
178
-
179
-
180
-
181
-
182
-
183
-
184
-
185
-
186
-
187
-
188
-
189
-
190
-
191
-
192
-
193
-
194
-
195
-
196
-
197
-
198
-
199
-
200
-
201
-
202
-
203
-
204
-
205
-
206
-
207
-
208
-
209
-
210
-
211
-
212
-
213
-
214
-
215
-
216
-
217
-
218
-
219
-
220
-
221
-
222
-
223
-
224
-
 225
225 -
 226
226 -
 227
227 -
 228
228 -
 229
229 -
 230
230 -
 231
231 -
 232
232 -
 233
233 -
 234
234 -
 235
235 -
 236
236 -
 237
237 -
 238
238 -
 239
239 -
 240
240 -
 241
241 -
 242
242 -
 243
243 -
 244
244 -
 245
245 -
246
-
247
-
248
-
249
-
250
-
251
-
252
-
253
-
254
-
255
-
256
-
257
-
258
-
259
-
260
-
261
-
262
-
263
-
264
-
265
-
266
-
267
-
268
-
269
-
270
-
271
-
272
-
273
-
274
-
275
-
276
-
277
-
278
-
279
-
280
-
281
-
282
-
283
-
284
-
285
-
286
-
287
-
288
-
289
-
290
-
291
-
292
-
293
-
294
-
295
-
296
-
297
-
298
-
299
-
300
-
301
-
302
-
303
-
304
-
305
-
306
-
307
-
308
-
309
-
310
-
311
-
312
-
313
-
314
-
315
-
316
-
317
-
318
-
319
-
320
-
321
-
322
-
323
-
324
-
325
-
326
-
327
-
328
-
329
-
330
-
331
-
332
-
333
-
334
-
335
-
336
-
337
-
338
-
339
-
340
-
341
-
342
 |
 |

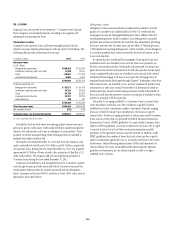
217
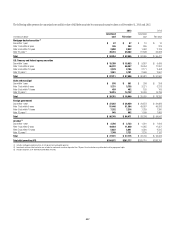
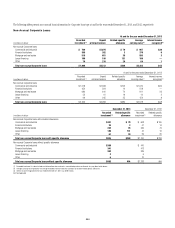
Consumer Credit Scores (FICO)
In the U.S., independent credit agencies rate an individual’s risk for
assuming debt based on the individual’s credit history and assign every
consumer a “FICO” credit score. These scores are continually updated by the
agencies based upon an individual’s credit actions (e.g., taking out a loan or
missed or late payments).
The following table provides details on the FICO scores attributable
to Citi’s U.S. Consumer loan portfolio as of December 31, 2013 and 2012
(commercial market loans are not included in the table since they are
business-based and FICO scores are not a primary driver in their credit
evaluation). FICO scores are updated monthly for substantially all of the
portfolio or, otherwise, on a quarterly basis.
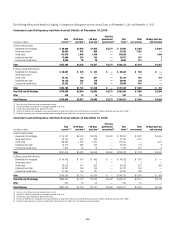
FICO score distribution in U.S. portfolio (1)(2) December 31, 2013
In millions of dollars
Less than
620 ≥ 620 but less
than 660
Equal to or
greater
than 660
Residential first mortgages $11,860 $ 6,426 $ 46,207
Home equity loans 4,093 2,779 23,152
Credit cards 8,125 10,693 94,437
Installment and other 3,900 2,399 5,186
Total $27,978 $22,297 $168,982
(1) Excludes loans guaranteed by U.S. government entities, loans subject to long-term standby
commitments (LTSCs) with U.S. government-sponsored entities and loans recorded at fair value.
(2) Excludes balances where FICO was not available. Such amounts are not material.
FICO score distribution in U.S. portfolio (1)(2) December 31, 2012
In millions of dollars
Less than
620 ≥ 620 but less
than 660
Equal to or
greater
than 660
Residential first mortgages $16,754 $ 8,013 $ 50,833
Home equity loans 5,439 3,208 26,820
Credit cards 7,833 10,304 90,248
Installment and other 4,414 2,417 5,365
Total $34,440 $23,942 $173,266
(1) Excludes loans guaranteed by U.S. government entities, loans subject to LTSCs with U.S.
government-sponsored entities and loans recorded at fair value.
(2) Excludes balances where FICO was not available. Such amounts are not material.
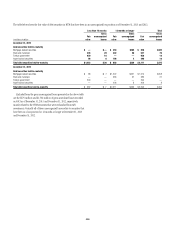
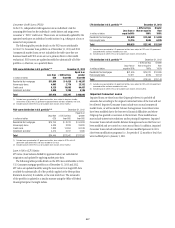
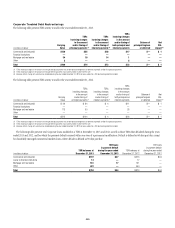
Loan to Value (LTV) Ratios
LTV ratios (loan balance divided by appraised value) are calculated at
origination and updated by applying market price data.
The following tables provide details on the LTV ratios attributable to Citi’s
U.S. Consumer mortgage portfolios as of December 31, 2013 and 2012.
LTV ratios are updated monthly using the most recent Core Logic HPI data
available for substantially all of the portfolio applied at the Metropolitan
Statistical Area level, if available, or the state level if not. The remainder
of the portfolio is updated in a similar manner using the Office of Federal
Housing Enterprise Oversight indices.
LTV distribution in U.S. portfolio (1)(2) December 31, 2013
In millions of dollars
Less than or
equal to 80%
> 80% but less
than or equal to
100%
Greater
than
100%
Residential first mortgages $45,809 $13,458 $ 5,269
Home equity loans 14,216 8,685 6,935
Total $60,025 $22,143 $12,204
(1) Excludes loans guaranteed by U.S. government entities, loans subject to LTSCs with U.S. government-
sponsored entities and loans recorded at fair value.
(2) Excludes balances where LTV was not available. Such amounts are not material.
LTV distribution in U.S. portfolio (1)(2) December 31, 2012
In millions of dollars
Less than or
equal to 80%
> 80% but less
than or equal to
100%
Greater
than
100%
Residential first mortgages $41,555 $19,070 $14,995
Home equity loans 12,611 9,529 13,153
Total $54,166 $28,599 $28,148
(1) Excludes loans guaranteed by U.S. government entities, loans subject to LTSCs with U.S. government-
sponsored entities and loans recorded at fair value.
(2) Excludes balances where LTV was not available. Such amounts are not material.
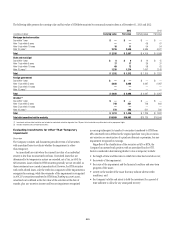
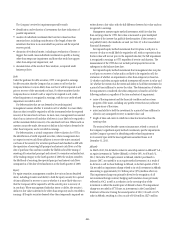
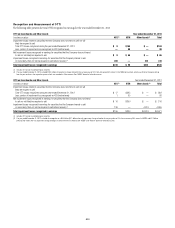
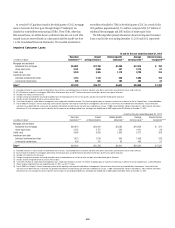
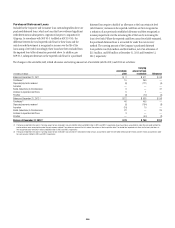
Impaired Consumer Loans
Impaired loans are those loans that Citigroup believes it is probable all
amounts due according to the original contractual terms of the loan will not
be collected. Impaired Consumer loans include non-accrual commercial
market loans, as well as smaller-balance homogeneous loans whose terms
have been modified due to the borrower’s financial difficulties and where
Citigroup has granted a concession to the borrower. These modifications
may include interest rate reductions and/or principal forgiveness. Impaired
Consumer loans exclude smaller-balance homogeneous loans that have not
been modified and are carried on a non-accrual basis. In addition, impaired
Consumer loans exclude substantially all loans modified pursuant to Citi’s
short-term modification programs (i.e., for periods of 12 months or less) that
were modified prior to January 1, 2011.