Citibank 2013 Annual Report Download - page 48
Download and view the complete annual report
Please find page 48 of the 2013 Citibank annual report below. You can navigate through the pages in the report by either clicking on the pages listed below, or by using the keyword search tool below to find specific information within the annual report.-
 1
1 -
2
-
3
-
4
-
5
-
6
-
7
-
8
-
9
-
10
-
11
-
12
-
13
-
14
-
15
-
16
-
17
-
18
-
19
-
20
-
21
-
22
-
23
-
24
-
25
-
26
-
27
-
28
-
29
-
30
-
31
-
32
-
33
-
34
-
35
-
36
-
37
-
 38
38 -
 39
39 -
 40
40 -
 41
41 -
 42
42 -
 43
43 -
 44
44 -
 45
45 -
 46
46 -
 47
47 -
 48
48 -
 49
49 -
 50
50 -
 51
51 -
 52
52 -
 53
53 -
 54
54 -
 55
55 -
 56
56 -
 57
57 -
 58
58 -
59
-
60
-
61
-
62
-
63
-
64
-
65
-
66
-
67
-
68
-
69
-
70
-
71
-
72
-
73
-
74
-
75
-
76
-
77
-
78
-
79
-
80
-
81
-
82
-
83
-
84
-
85
-
86
-
87
-
88
-
89
-
90
-
91
-
92
-
93
-
94
-
95
-
96
-
97
-
98
-
99
-
100
-
101
-
102
-
103
-
104
-
105
-
106
-
107
-
108
-
109
-
110
-
111
-
112
-
113
-
114
-
115
-
116
-
117
-
118
-
119
-
120
-
121
-
122
-
123
-
124
-
125
-
126
-
127
-
128
-
129
-
130
-
131
-
132
-
133
-
134
-
135
-
136
-
137
-
138
-
139
-
140
-
141
-
142
-
143
-
144
-
145
-
146
-
147
-
148
-
149
-
150
-
151
-
152
-
153
-
154
-
155
-
156
-
157
-
158
-
159
-
160
-
161
-
162
-
163
-
164
-
165
-
166
-
167
-
168
-
169
-
170
-
171
-
172
-
173
-
174
-
175
-
176
-
177
-
178
-
179
-
180
-
181
-
182
-
183
-
184
-
185
-
186
-
187
-
188
-
189
-
190
-
191
-
192
-
193
-
194
-
195
-
196
-
197
-
198
-
199
-
200
-
201
-
202
-
203
-
204
-
205
-
206
-
207
-
208
-
209
-
210
-
211
-
212
-
213
-
214
-
215
-
216
-
217
-
218
-
219
-
220
-
221
-
222
-
223
-
224
-
225
-
226
-
227
-
228
-
229
-
230
-
231
-
232
-
233
-
234
-
235
-
236
-
237
-
238
-
239
-
240
-
241
-
242
-
243
-
244
-
245
-
246
-
247
-
248
-
249
-
250
-
251
-
252
-
253
-
254
-
255
-
256
-
257
-
258
-
259
-
260
-
261
-
262
-
263
-
264
-
265
-
266
-
267
-
268
-
269
-
270
-
271
-
272
-
273
-
274
-
275
-
276
-
277
-
278
-
279
-
280
-
281
-
282
-
283
-
284
-
285
-
286
-
287
-
288
-
289
-
290
-
291
-
292
-
293
-
294
-
295
-
296
-
297
-
298
-
299
-
300
-
301
-
302
-
303
-
304
-
305
-
306
-
307
-
308
-
309
-
310
-
311
-
312
-
313
-
314
-
315
-
316
-
317
-
318
-
319
-
320
-
321
-
322
-
323
-
324
-
325
-
326
-
327
-
328
-
329
-
330
-
331
-
332
-
333
-
334
-
335
-
336
-
337
-
338
-
339
-
340
-
341
-
342
 |
 |

30
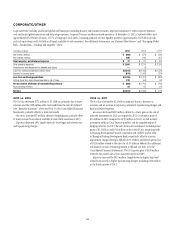
TRANSACTION SERVICES
Transaction Services is composed of Treasury and Trade Solutions and Securities and Fund Services. Treasury and Trade Solutions provides comprehensive
cash management and trade finance services for corporations, financial institutions and public sector entities worldwide. Securities and Fund Services
provides securities services to investors, such as global asset managers, custody and clearing services to intermediaries, such as broker-dealers, and depository
and agency/trust services to multinational corporations and governments globally. Revenue is generated from net interest revenue on the spread between
trade loans or intercompany placements and interest paid to customers on deposits as well as fees for transaction processing and fees on assets under custody
and administration.
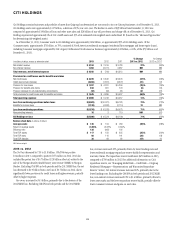
In millions of dollars, except as otherwise noted 2013 2012 2011
% Change
2013 vs. 2012
% Change
2012 vs. 2011
Net interest revenue $ 5,641 $6,006 $ 5,784 (6)% 4%
Non-interest revenue 4,919 4,702 4,647 51
Total revenues, net of interest expense $10,560 $10,708 $10,431 (1)% 3%
Total operating expenses 6,094 5,783 5,757 5—
Provisions for credit losses and for benefits and claims 71 154 36 (54) NM
Income before taxes and noncontrolling interests $ 4,395 $ 4,771 $ 4,638 (8)% 3%
Income taxes 1,479 1,371 1,387 8(1)
Income from continuing operations 2,916 3,400 3,251 (14) 5
Noncontrolling interests 19 17 19 12 (11)
Net income $ 2,897 $ 3,383 $ 3,232 (14)% 5%
Average assets (in billions of dollars) $ 160 $ 140 $ 131 14% 7%
Return on average assets 1.81% 2.42% 2.47%
Efficiency ratio 58 54 55
Revenues by region
North America $ 2,502 $ 2,554 $ 2,437 (2)% 5%
EMEA 3,533 3,488 3,397 13
Latin America 1,822 1,770 1,684 35
Asia 2,703 2,896 2,913 (7) (1)
Total revenues $10,560 $10,708 $10,431 (1)% 3%
Income from continuing operations by region
North America $ 541 $ 466 $ 408 16% 14%
EMEA 926 1,184 1,072 (22) 10
Latin America 451 642 623 (30) 3
Asia 998 1,108 1,148 (10) (3)
Total income from continuing operations $ 2,916 $ 3,400 $ 3,251 (14)% 5%
Foreign currency (FX) translation impact
Total revenue—as reported $10,560 $10,708 $10,431 (1)% 3%
Impact of FX translation (1) —(159) (409)
Total revenues—ex-FX $10,560 $10,549 $10,022 —% 5%
Total operating expenses—as reported $ 6,094 $ 5,783 $ 5,757 5% —%
Impact of FX translation (1) —(53) (147)
Total operating expenses—ex-FX $ 6,094 $ 5,730 $ 5,610 6% 2%
Net income—as reported $ 2,897 $ 3,383 $ 3,232 (14)% 5%
Impact of FX translation (1) —(106) (230)
Net income—ex-FX $ 2,897 $ 3,277 $ 3,002 (12)% 9%
Key indicators (in billions of dollars)
Average deposits and other customer liability balances—as reported $ 434 $ 404 $ 364 7% 11%
Impact of FX translation (1) —(1) (9)
Average deposits and other customer liability balances—ex-FX $ 434 $ 403 $ 355 8% 14%
EOP assets under custody (2) (in trillions of dollars) $ 14.3 $ 13.2 $ 12.0 8% 10%
(1) Reflects the impact of foreign exchange (FX) translation into U.S. dollars at 2013 average exchange rates for all periods presented.
(2) Includes assets under custody, assets under trust and assets under administration.
NM Not meaningful