Citibank 2013 Annual Report Download - page 203
Download and view the complete annual report
Please find page 203 of the 2013 Citibank annual report below. You can navigate through the pages in the report by either clicking on the pages listed below, or by using the keyword search tool below to find specific information within the annual report.-
 1
1 -
2
-
3
-
4
-
5
-
6
-
7
-
8
-
9
-
10
-
11
-
12
-
13
-
14
-
15
-
16
-
17
-
18
-
19
-
20
-
21
-
22
-
23
-
24
-
25
-
26
-
27
-
28
-
29
-
30
-
31
-
32
-
33
-
34
-
35
-
36
-
37
-
38
-
39
-
40
-
41
-
42
-
43
-
44
-
45
-
46
-
47
-
48
-
49
-
50
-
51
-
52
-
53
-
54
-
55
-
56
-
57
-
58
-
59
-
60
-
61
-
62
-
63
-
64
-
65
-
66
-
67
-
68
-
69
-
70
-
71
-
72
-
73
-
74
-
75
-
76
-
77
-
78
-
79
-
80
-
81
-
82
-
83
-
84
-
85
-
86
-
87
-
88
-
89
-
90
-
91
-
92
-
93
-
94
-
95
-
96
-
97
-
98
-
99
-
100
-
101
-
102
-
103
-
104
-
105
-
106
-
107
-
108
-
109
-
110
-
111
-
112
-
113
-
114
-
115
-
116
-
117
-
118
-
119
-
120
-
121
-
122
-
123
-
124
-
125
-
126
-
127
-
128
-
129
-
130
-
131
-
132
-
133
-
134
-
135
-
136
-
137
-
138
-
139
-
140
-
141
-
142
-
143
-
144
-
145
-
146
-
147
-
148
-
149
-
150
-
151
-
152
-
153
-
154
-
155
-
156
-
157
-
158
-
159
-
160
-
161
-
162
-
163
-
164
-
165
-
166
-
167
-
168
-
169
-
170
-
171
-
172
-
173
-
174
-
175
-
176
-
177
-
178
-
179
-
180
-
181
-
182
-
183
-
184
-
185
-
186
-
187
-
188
-
189
-
190
-
191
-
192
-
 193
193 -
 194
194 -
 195
195 -
 196
196 -
 197
197 -
 198
198 -
 199
199 -
 200
200 -
 201
201 -
 202
202 -
 203
203 -
 204
204 -
 205
205 -
 206
206 -
 207
207 -
 208
208 -
 209
209 -
 210
210 -
 211
211 -
 212
212 -
 213
213 -
214
-
215
-
216
-
217
-
218
-
219
-
220
-
221
-
222
-
223
-
224
-
225
-
226
-
227
-
228
-
229
-
230
-
231
-
232
-
233
-
234
-
235
-
236
-
237
-
238
-
239
-
240
-
241
-
242
-
243
-
244
-
245
-
246
-
247
-
248
-
249
-
250
-
251
-
252
-
253
-
254
-
255
-
256
-
257
-
258
-
259
-
260
-
261
-
262
-
263
-
264
-
265
-
266
-
267
-
268
-
269
-
270
-
271
-
272
-
273
-
274
-
275
-
276
-
277
-
278
-
279
-
280
-
281
-
282
-
283
-
284
-
285
-
286
-
287
-
288
-
289
-
290
-
291
-
292
-
293
-
294
-
295
-
296
-
297
-
298
-
299
-
300
-
301
-
302
-
303
-
304
-
305
-
306
-
307
-
308
-
309
-
310
-
311
-
312
-
313
-
314
-
315
-
316
-
317
-
318
-
319
-
320
-
321
-
322
-
323
-
324
-
325
-
326
-
327
-
328
-
329
-
330
-
331
-
332
-
333
-
334
-
335
-
336
-
337
-
338
-
339
-
340
-
341
-
342
 |
 |

185
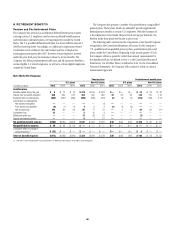
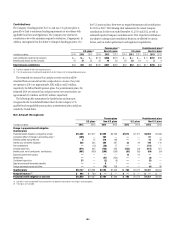
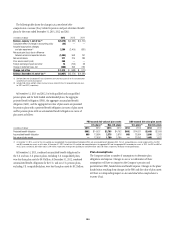
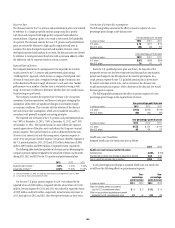
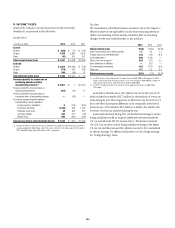
Certain assumptions used in determining pension and postretirement
benefit obligations and net benefit expenses for the Company’s plans are
shown in the following table:
At year end 2013 2012
Discount rate
U.S. plans (1)
Pension 4.75% 3.90%
Postretirement 4.35 3.60
Non-U.S. pension plans (2)
Range 1.60 to 29.25 1.50 to 28.00
Weighted average 5.60 5.24
Non-U.S. postretirement plans (2)
Range 3.50 to 11.90 3.50 to 10.00
Weighted average 8.65 7.46
Future compensation increase rate
U.S. plans (3) N/A N/A
Non-U.S. pension plans
Range 1.00 to 26.00 1.20 to 26.00
Weighted average 3.40 3.93
Expected return on assets
U.S. plans 7.00 7.00
Non-U.S. pension plans
Range 1.20 to 11.50 0.90 to 11.50
Weighted average 5.68 5.76
Non-U.S. postretirement plans
Range 8.50 to 8.90 8.50 to 9.60
Weighted average 8.50 8.50
(1) Effective April 1, 2013, Citigroup changed to a quarterly remeasurement approach for its six largest
plans, including the U.S. qualified pension and postretirement plans. For the U.S. qualified pension and
postretirement plans, the 2013 rates shown above were utilized to calculate the December 31, 2013
benefit obligation and will be used to determine the 2014 first quarter expense. The 2012 rates shown
above were utilized to calculate the December 31, 2012 benefit obligation and used for the 2013 first
quarter expense. For the U.S. nonqualified pension plans, the 2013 rates shown above were utilized
to calculate the December 31, 2013 benefit obligations and will be used to determine the expense
for 2014. The 2012 rates shown above were utilized to calculate the December 31, 2012 benefit
obligations and the expense for the full year 2013.
(2) Effective April 1, 2013, Citigroup changed to a quarterly remeasurement approach for its four largest
non-U.S. plans, including the qualified pension and postretirement plans. For the four largest non-U.S.
qualified pension and postretirement plans, the 2013 rates shown above were utilized to calculate the
December 31, 2013 benefit obligation and will be used to determine the 2014 first quarter expense. The
2012 rates shown above were utilized to calculate the December 31, 2012 benefit obligation and used
for the 2013 first quarter expense. For all other non-U.S. qualified pension and postretirement plans, the
2013 rates shown above were utilized to calculate the December 31, 2013 benefit obligations and will
be used to determine the expense for 2014. The 2012 rates shown above were utilized to calculate the
December 31, 2012 benefit obligations and the expense for the full year 2013.
(3) Since the U.S. qualified pension plan was frozen, a compensation increase rate applies only to certain
small groups of grandfathered employees accruing benefits under a final pay plan formula. Only the
future compensation increases for these grandfathered employees will affect future pension expense
and obligations. Compensation increase rates for these small groups of participants range from
3.00% to 4.00%.
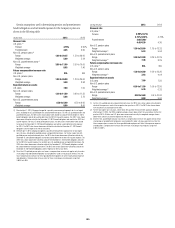
During the year 2013 2012
Discount rate
U.S. plans (1)
Pension 3.90%/4.2
4.75%/4.80
%/
%4.70%
Postretirement 3.60/3.60
4.40/4.30
/
4.30
Non-U.S. pension plans
Range 1.50 to 28.00 1.75 to 13.25
Weighted average (2) 5.24 5.94
Non-U.S. postretirement plans
Range 3.50 to 10.00 4.25 to 10.25
Weighted average (2) 7.46 8.25
Future compensation increase rate
U.S. plans (3) N/A N/A
Non-U.S. pension plans
Range 1.20 to 26.00 1.60 to 13.30
Weighted average (2) 3.93 4.04
Expected return on assets
U.S. plans 7.00 7.50
Non-U.S. pension plans
Range 0.90 to 11.50 1.00 to 12.50
Weighted average (2) 5.76 6.25
Non-U.S. postretirement plans
Range 8.50 to 9.60 9.5 to 10.00
Weighted average (2) 8.50 9.50
(1) For the U.S. qualified pension and postretirement plans, the 2013 rates shown above were utilized to
calculate the expense in each of the respective four quarters in 2013. The 2012 rates shown above
were utilized to calculate expense for 2012.
(2) For the four largest non-U.S. plans, which follow the quarterly remeasurement approach adopted
effective April 1, 2013, the 2013 weighted averages shown above reflect the assumptions for the first
quarter of 2013. All other non-U.S. plans were remeasured annually, the weighted averages shown
above were used to calculate the expense for the full year.
(3) Since the U.S. qualified pension plan was frozen, a compensation increase rate applies only to certain
small groups of grandfathered employees accruing benefits under a final pay plan formula. Only the
future compensation increases for these grandfathered employees will affect future pension expense
and obligations. Compensation increase rates for these small groups of participants range from
3.00% to 4.00%.