Citibank 2013 Annual Report Download - page 221
Download and view the complete annual report
Please find page 221 of the 2013 Citibank annual report below. You can navigate through the pages in the report by either clicking on the pages listed below, or by using the keyword search tool below to find specific information within the annual report.-
 1
1 -
2
-
3
-
4
-
5
-
6
-
7
-
8
-
9
-
10
-
11
-
12
-
13
-
14
-
15
-
16
-
17
-
18
-
19
-
20
-
21
-
22
-
23
-
24
-
25
-
26
-
27
-
28
-
29
-
30
-
31
-
32
-
33
-
34
-
35
-
36
-
37
-
38
-
39
-
40
-
41
-
42
-
43
-
44
-
45
-
46
-
47
-
48
-
49
-
50
-
51
-
52
-
53
-
54
-
55
-
56
-
57
-
58
-
59
-
60
-
61
-
62
-
63
-
64
-
65
-
66
-
67
-
68
-
69
-
70
-
71
-
72
-
73
-
74
-
75
-
76
-
77
-
78
-
79
-
80
-
81
-
82
-
83
-
84
-
85
-
86
-
87
-
88
-
89
-
90
-
91
-
92
-
93
-
94
-
95
-
96
-
97
-
98
-
99
-
100
-
101
-
102
-
103
-
104
-
105
-
106
-
107
-
108
-
109
-
110
-
111
-
112
-
113
-
114
-
115
-
116
-
117
-
118
-
119
-
120
-
121
-
122
-
123
-
124
-
125
-
126
-
127
-
128
-
129
-
130
-
131
-
132
-
133
-
134
-
135
-
136
-
137
-
138
-
139
-
140
-
141
-
142
-
143
-
144
-
145
-
146
-
147
-
148
-
149
-
150
-
151
-
152
-
153
-
154
-
155
-
156
-
157
-
158
-
159
-
160
-
161
-
162
-
163
-
164
-
165
-
166
-
167
-
168
-
169
-
170
-
171
-
172
-
173
-
174
-
175
-
176
-
177
-
178
-
179
-
180
-
181
-
182
-
183
-
184
-
185
-
186
-
187
-
188
-
189
-
190
-
191
-
192
-
193
-
194
-
195
-
196
-
197
-
198
-
199
-
200
-
201
-
202
-
203
-
204
-
205
-
206
-
207
-
208
-
209
-
210
-
 211
211 -
 212
212 -
 213
213 -
 214
214 -
 215
215 -
 216
216 -
 217
217 -
 218
218 -
 219
219 -
 220
220 -
 221
221 -
 222
222 -
 223
223 -
 224
224 -
 225
225 -
 226
226 -
 227
227 -
 228
228 -
 229
229 -
 230
230 -
 231
231 -
232
-
233
-
234
-
235
-
236
-
237
-
238
-
239
-
240
-
241
-
242
-
243
-
244
-
245
-
246
-
247
-
248
-
249
-
250
-
251
-
252
-
253
-
254
-
255
-
256
-
257
-
258
-
259
-
260
-
261
-
262
-
263
-
264
-
265
-
266
-
267
-
268
-
269
-
270
-
271
-
272
-
273
-
274
-
275
-
276
-
277
-
278
-
279
-
280
-
281
-
282
-
283
-
284
-
285
-
286
-
287
-
288
-
289
-
290
-
291
-
292
-
293
-
294
-
295
-
296
-
297
-
298
-
299
-
300
-
301
-
302
-
303
-
304
-
305
-
306
-
307
-
308
-
309
-
310
-
311
-
312
-
313
-
314
-
315
-
316
-
317
-
318
-
319
-
320
-
321
-
322
-
323
-
324
-
325
-
326
-
327
-
328
-
329
-
330
-
331
-
332
-
333
-
334
-
335
-
336
-
337
-
338
-
339
-
340
-
341
-
342
 |
 |

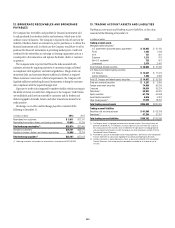
203
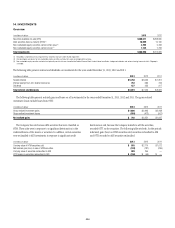
12. BROKERAGE RECEIVABLES AND BROKERAGE
PAYABLES
The Company has receivables and payables for financial instruments sold
to and purchased from brokers, dealers and customers, which arise in the
ordinary course of business. The Company is exposed to risk of loss from the
inability of brokers, dealers or customers to pay for purchases or to deliver the
financial instruments sold, in which case the Company would have to sell or
purchase the financial instruments at prevailing market prices. Credit risk
is reduced to the extent that an exchange or clearing organization acts as a
counterparty to the transaction and replaces the broker, dealer or customer
in question.
The Company seeks to protect itself from the risks associated with
customer activities by requiring customers to maintain margin collateral
in compliance with regulatory and internal guidelines. Margin levels are
monitored daily, and customers deposit additional collateral as required.
Where customers cannot meet collateral requirements, the Company will
liquidate sufficient underlying financial instruments to bring the customer
into compliance with the required margin level.
Exposure to credit risk is impacted by market volatility, which may impair
the ability of clients to satisfy their obligations to the Company. Credit limits
are established and closely monitored for customers and for brokers and
dealers engaged in forwards, futures and other transactions deemed to be
credit sensitive.
Brokerage receivables and Brokerage payables consisted of the
following at December 31:
In millions of dollars 2013 2012
Receivables from customers $ 5,811 $12,191
Receivables from brokers, dealers, and clearing organizations 19,863 10,299
Total brokerage receivables (1) $25,674 $22,490
Payables to customers $34,751 $38,279
Payables to brokers, dealers, and clearing organizations 18,956 18,734
Total brokerage payables (1) $53,707 $57,013
(1) Brokerage receivables and payables are accounted for in accordance with ASC 940-320.
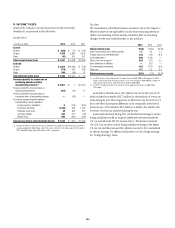
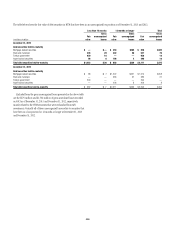
13. TRADING ACCOUNT ASSETS AND LIABILITIES
Trading account assets and Trading account liabilities, at fair value,
consisted of the following at December 31:
In millions of dollars 2013 2012
Trading account assets
Mortgage-backed securities (1)
U.S. government-sponsored agency guaranteed $ 23,955 $ 31,160
Prime 1,422 1,248
Alt-A 721 801
Subprime 1,211 812
Non-U.S. residential 723 607
Commercial 2,574 2,441
Total mortgage-backed securities $ 30,606 $ 37,069
U.S. Treasury and federal agency securities
U.S. Treasury $ 13,537 $ 17,472
Agency obligations 1,300 2,884
Total U.S. Treasury and federal agency securities $ 14,837 $ 20,356
State and municipal securities $ 3,207 $ 3,806
Foreign government securities 74,856 89,239
Corporate 30,534 35,224
Derivatives (2) 52,821 54,620
Equity securities 61,776 56,998
Asset-backed securities (1) 5,616 5,352
Other trading assets (3) 11,675 18,265
Total trading account assets $285,928 $320,929
Trading account liabilities
Securities sold, not yet purchased $ 61,508 $ 63,798
Derivatives (2) 47,254 51,751
Total trading account liabilities $108,762 $115,549
(1) The Company invests in mortgage-backed and asset-backed securities. These securitizations are
generally considered VIEs. The Company’s maximum exposure to loss from these VIEs is equal to
the carrying amount of the securities, which is reflected in the table above. For mortgage-backed
and asset-backed securitizations in which the Company has other involvement, see Note 22 to the
Consolidated Financial Statements.
(2) Presented net, pursuant to enforceable master netting agreements. See Note 23 to the Consolidated
Financial Statements for a discussion regarding the accounting and reporting for derivatives.
(3) Includes investments in unallocated precious metals, as discussed in Note 26 to the Consolidated
Financial Statements. Also includes physical commodities accounted for at the lower of cost or
fair value.