Citibank 2013 Annual Report Download - page 41
Download and view the complete annual report
Please find page 41 of the 2013 Citibank annual report below. You can navigate through the pages in the report by either clicking on the pages listed below, or by using the keyword search tool below to find specific information within the annual report.-
 1
1 -
2
-
3
-
4
-
5
-
6
-
7
-
8
-
9
-
10
-
11
-
12
-
13
-
14
-
15
-
16
-
17
-
18
-
19
-
20
-
21
-
22
-
23
-
24
-
25
-
26
-
27
-
28
-
29
-
30
-
 31
31 -
 32
32 -
 33
33 -
 34
34 -
 35
35 -
 36
36 -
 37
37 -
 38
38 -
 39
39 -
 40
40 -
 41
41 -
 42
42 -
 43
43 -
 44
44 -
 45
45 -
 46
46 -
 47
47 -
 48
48 -
 49
49 -
 50
50 -
 51
51 -
52
-
53
-
54
-
55
-
56
-
57
-
58
-
59
-
60
-
61
-
62
-
63
-
64
-
65
-
66
-
67
-
68
-
69
-
70
-
71
-
72
-
73
-
74
-
75
-
76
-
77
-
78
-
79
-
80
-
81
-
82
-
83
-
84
-
85
-
86
-
87
-
88
-
89
-
90
-
91
-
92
-
93
-
94
-
95
-
96
-
97
-
98
-
99
-
100
-
101
-
102
-
103
-
104
-
105
-
106
-
107
-
108
-
109
-
110
-
111
-
112
-
113
-
114
-
115
-
116
-
117
-
118
-
119
-
120
-
121
-
122
-
123
-
124
-
125
-
126
-
127
-
128
-
129
-
130
-
131
-
132
-
133
-
134
-
135
-
136
-
137
-
138
-
139
-
140
-
141
-
142
-
143
-
144
-
145
-
146
-
147
-
148
-
149
-
150
-
151
-
152
-
153
-
154
-
155
-
156
-
157
-
158
-
159
-
160
-
161
-
162
-
163
-
164
-
165
-
166
-
167
-
168
-
169
-
170
-
171
-
172
-
173
-
174
-
175
-
176
-
177
-
178
-
179
-
180
-
181
-
182
-
183
-
184
-
185
-
186
-
187
-
188
-
189
-
190
-
191
-
192
-
193
-
194
-
195
-
196
-
197
-
198
-
199
-
200
-
201
-
202
-
203
-
204
-
205
-
206
-
207
-
208
-
209
-
210
-
211
-
212
-
213
-
214
-
215
-
216
-
217
-
218
-
219
-
220
-
221
-
222
-
223
-
224
-
225
-
226
-
227
-
228
-
229
-
230
-
231
-
232
-
233
-
234
-
235
-
236
-
237
-
238
-
239
-
240
-
241
-
242
-
243
-
244
-
245
-
246
-
247
-
248
-
249
-
250
-
251
-
252
-
253
-
254
-
255
-
256
-
257
-
258
-
259
-
260
-
261
-
262
-
263
-
264
-
265
-
266
-
267
-
268
-
269
-
270
-
271
-
272
-
273
-
274
-
275
-
276
-
277
-
278
-
279
-
280
-
281
-
282
-
283
-
284
-
285
-
286
-
287
-
288
-
289
-
290
-
291
-
292
-
293
-
294
-
295
-
296
-
297
-
298
-
299
-
300
-
301
-
302
-
303
-
304
-
305
-
306
-
307
-
308
-
309
-
310
-
311
-
312
-
313
-
314
-
315
-
316
-
317
-
318
-
319
-
320
-
321
-
322
-
323
-
324
-
325
-
326
-
327
-
328
-
329
-
330
-
331
-
332
-
333
-
334
-
335
-
336
-
337
-
338
-
339
-
340
-
341
-
342
 |
 |
23
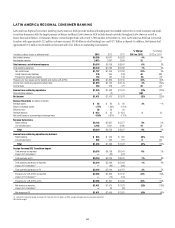
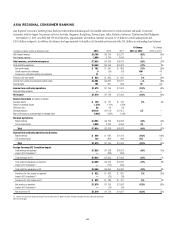
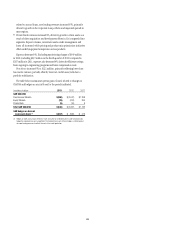
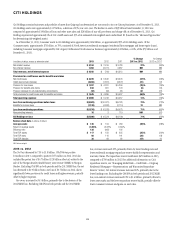
The discussion of the results of operations for Latin America RCB below excludes the impact of FX translation for all periods presented. Presentation
of the results of operations, excluding the impact of FX translation, are non-GAAP financial measures. Citi believes the presentation of Latin America
RCB’s results excluding the impact of FX translation is a more meaningful depiction of the underlying fundamentals of the business. For a
reconciliation of certain of these metrics to the reported results, see the table above.
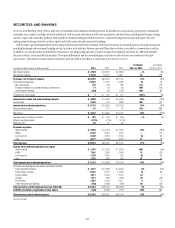
2013 vs. 2012
Net income decreased 4% as higher credit costs, higher expenses and
a higher effective tax rate (see Note 9 to the Consolidated Financial
Statements) were partially offset by higher revenues.
Revenues increased 7%, primarily due to volume growth in retail banking
and cards, partially offset by continued spread compression. Net interest
revenue increased 4% due to increased volumes, partially offset by spread
compression. Non-interest revenue increased 12%, primarily due to higher
fees from increased business volumes in retail and cards. Retail banking
revenues increased 5% as average loans increased 12%, investment sales
increased 13% and average deposits increased 3%. Cards revenues increased
11% as average loans increased 10% and purchase sales increased 13%,
excluding the impact of Credicard (see Note 2 to the Consolidated Financial
Statements). Citi expects revenues in Latin America RCB could continue to
be negatively impacted by spread compression during 2014, particularly in
Mexico.
Expenses increased 2% due to increased volume-related costs, mandatory
salary increases in certain countries and higher regulatory costs, partially
offset by lower repositioning charges and higher repositioning savings.
Provisions increased 25%, primarily due to higher net credit losses as well
as a higher loan loss reserve build. Net credit losses increased 25%, primarily
in the Mexico cards and personal loan portfolios, reflecting both volume
growth and portfolio seasoning, which Citi expects to continue into 2014.
The loan loss reserve build increased 50%, primarily due to an increase in
reserves in Mexico related to the top three Mexican homebuilders, with the
remainder due to portfolio growth and seasoning and the impact of potential
losses related to hurricanes in the region during September 2013.
During 2013, homebuilders in Mexico began to experience financial
difficulties, primarily due to, among other things, decreases in government
subsidies, new government policies promoting vertical housing and an
overall renewed government emphasis on urban planning. The loan loss
reserve build related to the Mexican homebuilders in 2013 was driven by
deterioration in the financial and operating conditions of these companies
and decreases in the value of Citi’s collateral securing its loans. Citi’s
outstanding loans to the top three homebuilders totaled $251 million at
year-end 2013. Citi continues to monitor the performance of its Mexico
homebuilder clients, as well as the value of its collateral, to determine
whether additional reserves or charge-offs may be required in future periods.
Going into 2014, absent any significant market developments, including
further deterioration in Citi’s Mexican homebuilders clients or losses from the
hurricanes in 2013, Citi expects net credit losses and reserve builds to be in
line with portfolio growth and seasoning.
For information on the potential impact to Latin America RCB from
foreign exchange controls, see “Managing Global Risk—Country and Cross-
Border Risk—Cross-Border Risk” below.
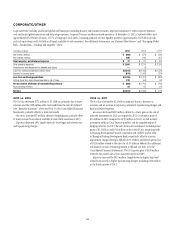
2012 vs. 2011
Net income declined 6% as higher revenues were offset by higher credit costs
and expenses.
Revenues increased 8%, primarily due to revenue growth in Mexico
and higher volumes, mostly related to personal loans and credit cards. Net
interest revenue increased 9% due to increased volumes, partially offset by
continued spread compression. Non-interest revenue increased 6%, primarily
due to increased business volumes in the private pension fund and insurance
businesses.
Expenses increased 7%, primarily due to $131 million of repositioning
charges in the fourth quarter of 2012, higher volume-driven expenses and
increased legal and related costs.
Provisions increased 50%, primarily due to increased loan loss reserve
builds driven by underlying business volume growth, primarily in Mexico
and Colombia. In addition, net credit losses increased in the retail portfolios,
primarily in Mexico, reflecting volume growth.