Citibank 2013 Annual Report Download - page 246
Download and view the complete annual report
Please find page 246 of the 2013 Citibank annual report below. You can navigate through the pages in the report by either clicking on the pages listed below, or by using the keyword search tool below to find specific information within the annual report.-
 1
1 -
2
-
3
-
4
-
5
-
6
-
7
-
8
-
9
-
10
-
11
-
12
-
13
-
14
-
15
-
16
-
17
-
18
-
19
-
20
-
21
-
22
-
23
-
24
-
25
-
26
-
27
-
28
-
29
-
30
-
31
-
32
-
33
-
34
-
35
-
36
-
37
-
38
-
39
-
40
-
41
-
42
-
43
-
44
-
45
-
46
-
47
-
48
-
49
-
50
-
51
-
52
-
53
-
54
-
55
-
56
-
57
-
58
-
59
-
60
-
61
-
62
-
63
-
64
-
65
-
66
-
67
-
68
-
69
-
70
-
71
-
72
-
73
-
74
-
75
-
76
-
77
-
78
-
79
-
80
-
81
-
82
-
83
-
84
-
85
-
86
-
87
-
88
-
89
-
90
-
91
-
92
-
93
-
94
-
95
-
96
-
97
-
98
-
99
-
100
-
101
-
102
-
103
-
104
-
105
-
106
-
107
-
108
-
109
-
110
-
111
-
112
-
113
-
114
-
115
-
116
-
117
-
118
-
119
-
120
-
121
-
122
-
123
-
124
-
125
-
126
-
127
-
128
-
129
-
130
-
131
-
132
-
133
-
134
-
135
-
136
-
137
-
138
-
139
-
140
-
141
-
142
-
143
-
144
-
145
-
146
-
147
-
148
-
149
-
150
-
151
-
152
-
153
-
154
-
155
-
156
-
157
-
158
-
159
-
160
-
161
-
162
-
163
-
164
-
165
-
166
-
167
-
168
-
169
-
170
-
171
-
172
-
173
-
174
-
175
-
176
-
177
-
178
-
179
-
180
-
181
-
182
-
183
-
184
-
185
-
186
-
187
-
188
-
189
-
190
-
191
-
192
-
193
-
194
-
195
-
196
-
197
-
198
-
199
-
200
-
201
-
202
-
203
-
204
-
205
-
206
-
207
-
208
-
209
-
210
-
211
-
212
-
213
-
214
-
215
-
216
-
217
-
218
-
219
-
220
-
221
-
222
-
223
-
224
-
225
-
226
-
227
-
228
-
229
-
230
-
231
-
232
-
233
-
234
-
235
-
 236
236 -
 237
237 -
 238
238 -
 239
239 -
 240
240 -
 241
241 -
 242
242 -
 243
243 -
 244
244 -
 245
245 -
 246
246 -
 247
247 -
 248
248 -
 249
249 -
 250
250 -
 251
251 -
 252
252 -
 253
253 -
 254
254 -
 255
255 -
 256
256 -
257
-
258
-
259
-
260
-
261
-
262
-
263
-
264
-
265
-
266
-
267
-
268
-
269
-
270
-
271
-
272
-
273
-
274
-
275
-
276
-
277
-
278
-
279
-
280
-
281
-
282
-
283
-
284
-
285
-
286
-
287
-
288
-
289
-
290
-
291
-
292
-
293
-
294
-
295
-
296
-
297
-
298
-
299
-
300
-
301
-
302
-
303
-
304
-
305
-
306
-
307
-
308
-
309
-
310
-
311
-
312
-
313
-
314
-
315
-
316
-
317
-
318
-
319
-
320
-
321
-
322
-
323
-
324
-
325
-
326
-
327
-
328
-
329
-
330
-
331
-
332
-
333
-
334
-
335
-
336
-
337
-
338
-
339
-
340
-
341
-
342
 |
 |

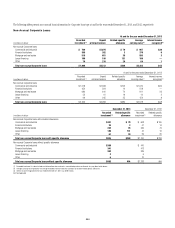
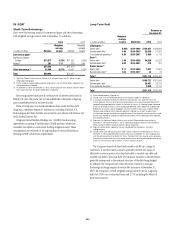
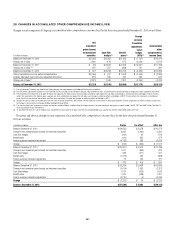
228
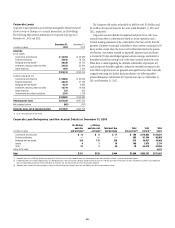
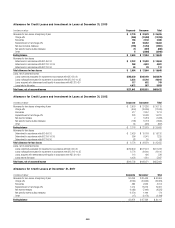
Allowance for Credit Losses and Investment in Loans at December 31, 2013
In millions of dollars Corporate Consumer Total
Allowance for loan losses at beginning of year $ 2,776 $ 22,679 $ 25,455
Charge-offs (369) (12,400) (12,769)
Recoveries 168 2,138 2,306
Replenishment of net charge-offs 201 10,262 10,463
Net reserve builds (releases) (199) (1,762) (1,961)
Net specific reserve builds (releases) (1) (897) (898)
Other 8 (2,956) (2,948)
Ending balance $ 2,584 $ 17,064 $ 19,648
Allowance for loan losses
Determined in accordance with ASC 450-20 $ 2,232 $ 12,402 $ 14,634
Determined in accordance with ASC 310-10-35 268 4,633 4,901
Determined in accordance with ASC 310-30 84 29 113
Total allowance for loan losses $ 2,584 $ 17,064 $ 19,648
Loans, net of unearned income
Loans collectively evaluated for impairment in accordance with ASC 450-20 $265,230 $368,449 $633,679
Loans individually evaluated for impairment in accordance with ASC 310-10-35 2,222 23,793 26,015
Loans acquired with deteriorated credit quality in accordance with ASC 310-30 117 632 749
Loans held at fair value 4,072 957 5,029
Total loans, net of unearned income $271,641 $393,831 $665,472
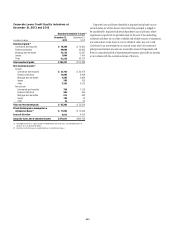
Allowance for Credit Losses and Investment in Loans at December 31, 2012
In millions of dollars Corporate Consumer Total
Allowance for loan losses at beginning of year $ 2,879 $ 27,236 $ 30,115
Charge-offs (640) (16,365) (17,005)
Recoveries 417 2,357 2,774
Replenishment of net charge-offs 223 14,008 14,231
Net reserve releases 2 (1,910) (1,908)
Net specific reserve builds (releases) (138) (1,727) (1,865)
Other 33 (920) (887)
Ending balance $ 2,776 $ 22,679 $ 25,455
Allowance for loan losses
Determined in accordance with ASC 450-20 $ 2,429 $ 15,703 $ 18,132
Determined in accordance with ASC 310-10-35 284 6,941 7,225
Determined in accordance with ASC 310-30 63 35 98
Total allowance for loan losses $ 2,776 $ 22,679 $ 25,455
Loans, net of unearned income
Loans collectively evaluated for impairment in accordance with ASC 450-20 $239,849 $377,374 $617,223
Loans individually evaluated for impairment in accordance with ASC 310-10-35 2,776 29,640 32,416
Loans acquired with deteriorated credit quality in accordance with ASC 310-30 112 426 538
Loans held at fair value 4,056 1,231 5,287
Total loans, net of unearned income $246,793 $408,671 $655,464
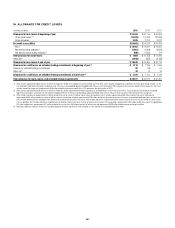
Allowance for Credit Losses at December 31, 2011
In millions of dollars Corporate Consumer Total
Allowance for loan losses at beginning of year $ 5,249 $ 35,406 $ 40,655
Charge-offs (2,000) (20,699) (22,699)
Recoveries 386 2,626 3,012
Replenishment of net charge-offs 1,614 18,073 19,687
Net reserve releases (1,083) (7,442) (8,525)
Net specific reserve builds (releases) (1,270) 1,444 174
Other (17) (2,172) (2,189)
Ending balance $ 2,879 $ 27,236 $ 30,115