Citibank 2013 Annual Report Download - page 118
Download and view the complete annual report
Please find page 118 of the 2013 Citibank annual report below. You can navigate through the pages in the report by either clicking on the pages listed below, or by using the keyword search tool below to find specific information within the annual report.-
 1
1 -
2
-
3
-
4
-
5
-
6
-
7
-
8
-
9
-
10
-
11
-
12
-
13
-
14
-
15
-
16
-
17
-
18
-
19
-
20
-
21
-
22
-
23
-
24
-
25
-
26
-
27
-
28
-
29
-
30
-
31
-
32
-
33
-
34
-
35
-
36
-
37
-
38
-
39
-
40
-
41
-
42
-
43
-
44
-
45
-
46
-
47
-
48
-
49
-
50
-
51
-
52
-
53
-
54
-
55
-
56
-
57
-
58
-
59
-
60
-
61
-
62
-
63
-
64
-
65
-
66
-
67
-
68
-
69
-
70
-
71
-
72
-
73
-
74
-
75
-
76
-
77
-
78
-
79
-
80
-
81
-
82
-
83
-
84
-
85
-
86
-
87
-
88
-
89
-
90
-
91
-
92
-
93
-
94
-
95
-
96
-
97
-
98
-
99
-
100
-
101
-
102
-
103
-
104
-
105
-
106
-
107
-
 108
108 -
 109
109 -
 110
110 -
 111
111 -
 112
112 -
 113
113 -
 114
114 -
 115
115 -
 116
116 -
 117
117 -
 118
118 -
 119
119 -
 120
120 -
 121
121 -
 122
122 -
 123
123 -
 124
124 -
 125
125 -
 126
126 -
 127
127 -
 128
128 -
129
-
130
-
131
-
132
-
133
-
134
-
135
-
136
-
137
-
138
-
139
-
140
-
141
-
142
-
143
-
144
-
145
-
146
-
147
-
148
-
149
-
150
-
151
-
152
-
153
-
154
-
155
-
156
-
157
-
158
-
159
-
160
-
161
-
162
-
163
-
164
-
165
-
166
-
167
-
168
-
169
-
170
-
171
-
172
-
173
-
174
-
175
-
176
-
177
-
178
-
179
-
180
-
181
-
182
-
183
-
184
-
185
-
186
-
187
-
188
-
189
-
190
-
191
-
192
-
193
-
194
-
195
-
196
-
197
-
198
-
199
-
200
-
201
-
202
-
203
-
204
-
205
-
206
-
207
-
208
-
209
-
210
-
211
-
212
-
213
-
214
-
215
-
216
-
217
-
218
-
219
-
220
-
221
-
222
-
223
-
224
-
225
-
226
-
227
-
228
-
229
-
230
-
231
-
232
-
233
-
234
-
235
-
236
-
237
-
238
-
239
-
240
-
241
-
242
-
243
-
244
-
245
-
246
-
247
-
248
-
249
-
250
-
251
-
252
-
253
-
254
-
255
-
256
-
257
-
258
-
259
-
260
-
261
-
262
-
263
-
264
-
265
-
266
-
267
-
268
-
269
-
270
-
271
-
272
-
273
-
274
-
275
-
276
-
277
-
278
-
279
-
280
-
281
-
282
-
283
-
284
-
285
-
286
-
287
-
288
-
289
-
290
-
291
-
292
-
293
-
294
-
295
-
296
-
297
-
298
-
299
-
300
-
301
-
302
-
303
-
304
-
305
-
306
-
307
-
308
-
309
-
310
-
311
-
312
-
313
-
314
-
315
-
316
-
317
-
318
-
319
-
320
-
321
-
322
-
323
-
324
-
325
-
326
-
327
-
328
-
329
-
330
-
331
-
332
-
333
-
334
-
335
-
336
-
337
-
338
-
339
-
340
-
341
-
342
 |
 |

100
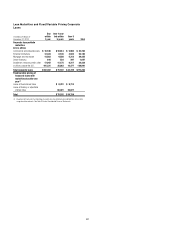
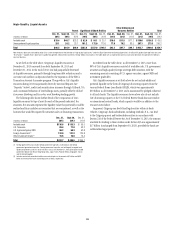
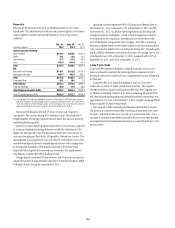
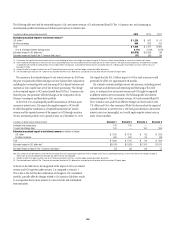
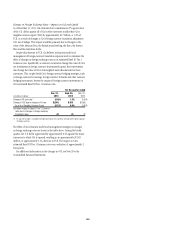
Deposits
Deposits are the primary and lowest cost funding source for Citi’s bank
subsidiaries. The table below sets forth the end of period deposits, by business
and/or segment, and the total average deposits for each of the periods
indicated.
In billions of dollars
Dec. 31,
2013
Sept. 30,
2013
Dec. 31,
2012
Global Consumer Banking
North America $170.2 $168.6 $165.2
EMEA 13.1 12.5 13.2
Latin America 47.7 47.5 48.6
Asia 101.4 101.6 110.0
Total $332.4 $330.2 $337.0
ICG
Securities and Banking $110.1 $112.6 $114.4
Transaction Services 463.7 452.8 408.7
Total $573.8 $565.4 $523.1
Corporate/Other 26.1 18.0 2.5
Total Citicorp $932.3 $913.6 $862.6
Total Citi Holdings (1) 36.0 41.8 68.0
Total Citigroup Deposits (EOP) $968.3 $955.4 $930.6
Total Citigroup Deposits (AVG) $956.4 $922.1 $928.9
(1) Included within Citi’s end-of-period deposit balance as of December 31, 2013 were approximately
$30 billion of deposits related to Morgan Stanley Smith Barney (MSSB) customers that, as previously
disclosed, will be transferred to Morgan Stanley, with remaining balances transferred in the amount of
approximately $5 billion per quarter through the end of the second quarter of 2015.
End-of-period deposits increased 4% year-over-year and 1% quarter-
over-quarter. The increase during 2013 reflected, in part, elevated levels of
market liquidity and strong corporate balance sheets, but also was driven by
underlying business growth.
Global Consumer Banking deposits decreased 1% year-over-year, as growth
in consumer checking and savings balances was offset by reductions in Citi’s
higher cost time deposits. Corporate deposits increased 10% year-over-year, as
continued strong deposit flows led to 13% growth in Transaction Services. This
deposit growth in Transaction Services was offset by a 4% decline in Securities
and Banking deposits driven by reduced deposit balances with counterparties
in Citi’s Markets businesses, while deposits increased in the Private Bank.
Corporate/Other deposits also increased year-over-year as Citi issued tenored
time deposits to further diversify its funding sources.
Average deposits increased 3% year-over-year and 4% quarter-over-quarter,
despite the transfer of approximately $26 billion of deposits relating to MSSB
to Morgan Stanley during the second half of 2013.
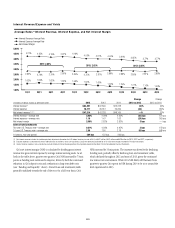
Operating balances represented 80% of Citicorp’s total deposit base as
of December 31, 2013, compared to 79% at September 30, 2013 and 78%
at December 31, 2012. Citi defines operating balances as checking and
savings accounts for individuals, as well as cash management accounts
for corporations; by comparison, time deposits have fixed rates for the
term of the deposit and generally lower margins. This shift to operating
balances, combined with overall market conditions and prevailing interest
rates, continued to reduce Citi’s cost of deposits during 2013. Excluding the
impact of FDIC assessments and deposit insurance, the average rate on Citi’s
total deposits was 0.50% at December 31, 2013, compared with 0.53% at
September 30, 2013, and 0.65% at December 31, 2012.
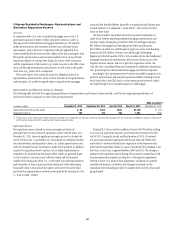
Long-Term Debt
Long-term debt (generally defined as original maturities of one year or
more) continued to represent the most significant component of Citi’s
funding for the parent entities and was a supplementary source of funding
for the bank.
Long-term debt is an important funding source for Citi’s parent
entities due in part to its multi-year maturity structure. The weighted-
average maturities of unsecured long-term debt issued by Citigroup and
its affiliates (including Citibank, N.A.) with a remaining life greater than
one year (excluding remaining trust preferred securities outstanding) was
approximately 7.0 years as of December 31, 2013, roughly unchanged from
the prior quarter and prior-year periods.
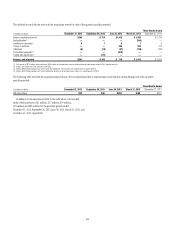
Citi’s long-term debt outstanding includes benchmark debt and what
Citi refers to as customer-related debt, consisting of structured notes, such
as equity- and credit-linked notes, as well as non-structured notes. Citi’s
issuance of customer-related debt is generally driven by customer demand
and supplements benchmark debt issuance as a source of funding for Citi’s
parent entities.