Citibank 2013 Annual Report Download - page 171
Download and view the complete annual report
Please find page 171 of the 2013 Citibank annual report below. You can navigate through the pages in the report by either clicking on the pages listed below, or by using the keyword search tool below to find specific information within the annual report.-
 1
1 -
2
-
3
-
4
-
5
-
6
-
7
-
8
-
9
-
10
-
11
-
12
-
13
-
14
-
15
-
16
-
17
-
18
-
19
-
20
-
21
-
22
-
23
-
24
-
25
-
26
-
27
-
28
-
29
-
30
-
31
-
32
-
33
-
34
-
35
-
36
-
37
-
38
-
39
-
40
-
41
-
42
-
43
-
44
-
45
-
46
-
47
-
48
-
49
-
50
-
51
-
52
-
53
-
54
-
55
-
56
-
57
-
58
-
59
-
60
-
61
-
62
-
63
-
64
-
65
-
66
-
67
-
68
-
69
-
70
-
71
-
72
-
73
-
74
-
75
-
76
-
77
-
78
-
79
-
80
-
81
-
82
-
83
-
84
-
85
-
86
-
87
-
88
-
89
-
90
-
91
-
92
-
93
-
94
-
95
-
96
-
97
-
98
-
99
-
100
-
101
-
102
-
103
-
104
-
105
-
106
-
107
-
108
-
109
-
110
-
111
-
112
-
113
-
114
-
115
-
116
-
117
-
118
-
119
-
120
-
121
-
122
-
123
-
124
-
125
-
126
-
127
-
128
-
129
-
130
-
131
-
132
-
133
-
134
-
135
-
136
-
137
-
138
-
139
-
140
-
141
-
142
-
143
-
144
-
145
-
146
-
147
-
148
-
149
-
150
-
151
-
152
-
153
-
154
-
155
-
156
-
157
-
158
-
159
-
160
-
 161
161 -
 162
162 -
 163
163 -
 164
164 -
 165
165 -
 166
166 -
 167
167 -
 168
168 -
 169
169 -
 170
170 -
 171
171 -
 172
172 -
 173
173 -
 174
174 -
 175
175 -
 176
176 -
 177
177 -
 178
178 -
 179
179 -
 180
180 -
 181
181 -
182
-
183
-
184
-
185
-
186
-
187
-
188
-
189
-
190
-
191
-
192
-
193
-
194
-
195
-
196
-
197
-
198
-
199
-
200
-
201
-
202
-
203
-
204
-
205
-
206
-
207
-
208
-
209
-
210
-
211
-
212
-
213
-
214
-
215
-
216
-
217
-
218
-
219
-
220
-
221
-
222
-
223
-
224
-
225
-
226
-
227
-
228
-
229
-
230
-
231
-
232
-
233
-
234
-
235
-
236
-
237
-
238
-
239
-
240
-
241
-
242
-
243
-
244
-
245
-
246
-
247
-
248
-
249
-
250
-
251
-
252
-
253
-
254
-
255
-
256
-
257
-
258
-
259
-
260
-
261
-
262
-
263
-
264
-
265
-
266
-
267
-
268
-
269
-
270
-
271
-
272
-
273
-
274
-
275
-
276
-
277
-
278
-
279
-
280
-
281
-
282
-
283
-
284
-
285
-
286
-
287
-
288
-
289
-
290
-
291
-
292
-
293
-
294
-
295
-
296
-
297
-
298
-
299
-
300
-
301
-
302
-
303
-
304
-
305
-
306
-
307
-
308
-
309
-
310
-
311
-
312
-
313
-
314
-
315
-
316
-
317
-
318
-
319
-
320
-
321
-
322
-
323
-
324
-
325
-
326
-
327
-
328
-
329
-
330
-
331
-
332
-
333
-
334
-
335
-
336
-
337
-
338
-
339
-
340
-
341
-
342
 |
 |

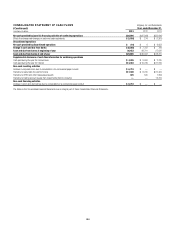
153
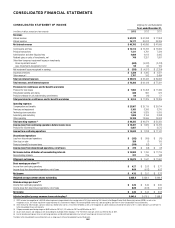
CONSOLIDATED STATEMENT OF CASH FLOWS Citigroup Inc. and Subsidiaries
Years ended December 31,
In millions of dollars 2013 2012 2011
Cash flows from operating activities of continuing operations
Net income before attribution of noncontrolling interests $ 13,900 $ 7,760 $ 11,215
Net income attributable to noncontrolling interests 227 219 148
Citigroup’s net income $ 13,673 $ 7,541 $ 11,067
Loss from discontinued operations, net of taxes (90) (57) (27)
Gain (loss) on sale, net of taxes 360 (1) 95
Income from continuing operations—excluding noncontrolling interests $ 13,403 $ 7,599 $ 10,999
Adjustments to reconcile net income to net cash provided by (used in) operating activities of continuing operations
Amortization of deferred policy acquisition costs and present value of future profits 194 203 250
(Additions) reductions to deferred policy acquisition costs (54) 85 (54)
Depreciation and amortization 3,303 2,507 2,872
Deferred tax provision (benefit) 2,380 (4,091) (74)
Provision for credit losses 7,684 10,832 11,824
Realized gains from sales of investments (748) (3,251) (1,997)
Net impairment losses recognized in earnings 535 4,971 2,254
Change in trading account assets 35,001 (29,195) 38,238
Change in trading account liabilities (6,787) (10,533) (2,972)
Change in federal funds sold and securities borrowed or purchased under agreements to resell 4,274 14,538 (29,132)
Change in federal funds purchased and securities loaned or sold under agreements to repurchase (7,724) 12,863 8,815
Change in brokerage receivables net of brokerage payables (6,490) 945 8,383
Change in loans held-for-sale 4,321 (1,106) 1,021
Change in other assets 13,332 (530) 14,949
Change in other liabilities (7,880) (1,457) (3,814)
Other, net 2,666 9,885 3,233
Total adjustments $ 44,007 $ 6,666 $ 53,796
Net cash provided by operating activities of continuing operations $ 57,410 $ 14,265 $ 64,795
Cash flows from investing activities of continuing operations
Change in deposits with banks $ (66,871) $ 53,650 $ 6,653
Change in loans (27,892) (28,817) (31,597)
Proceeds from sales and securitizations of loans 9,123 7,287 10,022
Purchases of investments (220,823) (256,907) (314,250)
Proceeds from sales of investments 131,100 143,853 182,566
Proceeds from maturities of investments 84,831 102,020 139,959
Capital expenditures on premises and equipment and capitalized software (3,490) (3,604) (3,448)
Proceeds from sales of premises and equipment, subsidiaries and affiliates, and repossessed assets 716 1,089 1,323
Net cash provided by (used in) investing activities of continuing operations $ (93,306) $ 18,571 $ (8,772)
Cash flows from financing activities of continuing operations
Dividends paid $ (314) $ (143) $ (107)
Issuance of preferred stock 4,270 2,250 —
Redemption of preferred stock (94) — —
Issuance of ADIA Upper DECs equity units purchase contract —— 3,750
Treasury stock acquired (837) (5) (1)
Stock tendered for payment of withholding taxes (452) (194) (230)
Issuance of long-term debt 54,405 27,843 30,242
Payments and redemptions of long-term debt (63,994) (117,575) (89,091)
Change in deposits 37,713 64,624 23,858
Change in short-term borrowings 199 (2,164) (25,067)
Statement continues on the next page.