Citibank 2013 Annual Report Download - page 40
Download and view the complete annual report
Please find page 40 of the 2013 Citibank annual report below. You can navigate through the pages in the report by either clicking on the pages listed below, or by using the keyword search tool below to find specific information within the annual report.-
 1
1 -
2
-
3
-
4
-
5
-
6
-
7
-
8
-
9
-
10
-
11
-
12
-
13
-
14
-
15
-
16
-
17
-
18
-
19
-
20
-
21
-
22
-
23
-
24
-
25
-
26
-
27
-
28
-
29
-
 30
30 -
 31
31 -
 32
32 -
 33
33 -
 34
34 -
 35
35 -
 36
36 -
 37
37 -
 38
38 -
 39
39 -
 40
40 -
 41
41 -
 42
42 -
 43
43 -
 44
44 -
 45
45 -
 46
46 -
 47
47 -
 48
48 -
 49
49 -
 50
50 -
51
-
52
-
53
-
54
-
55
-
56
-
57
-
58
-
59
-
60
-
61
-
62
-
63
-
64
-
65
-
66
-
67
-
68
-
69
-
70
-
71
-
72
-
73
-
74
-
75
-
76
-
77
-
78
-
79
-
80
-
81
-
82
-
83
-
84
-
85
-
86
-
87
-
88
-
89
-
90
-
91
-
92
-
93
-
94
-
95
-
96
-
97
-
98
-
99
-
100
-
101
-
102
-
103
-
104
-
105
-
106
-
107
-
108
-
109
-
110
-
111
-
112
-
113
-
114
-
115
-
116
-
117
-
118
-
119
-
120
-
121
-
122
-
123
-
124
-
125
-
126
-
127
-
128
-
129
-
130
-
131
-
132
-
133
-
134
-
135
-
136
-
137
-
138
-
139
-
140
-
141
-
142
-
143
-
144
-
145
-
146
-
147
-
148
-
149
-
150
-
151
-
152
-
153
-
154
-
155
-
156
-
157
-
158
-
159
-
160
-
161
-
162
-
163
-
164
-
165
-
166
-
167
-
168
-
169
-
170
-
171
-
172
-
173
-
174
-
175
-
176
-
177
-
178
-
179
-
180
-
181
-
182
-
183
-
184
-
185
-
186
-
187
-
188
-
189
-
190
-
191
-
192
-
193
-
194
-
195
-
196
-
197
-
198
-
199
-
200
-
201
-
202
-
203
-
204
-
205
-
206
-
207
-
208
-
209
-
210
-
211
-
212
-
213
-
214
-
215
-
216
-
217
-
218
-
219
-
220
-
221
-
222
-
223
-
224
-
225
-
226
-
227
-
228
-
229
-
230
-
231
-
232
-
233
-
234
-
235
-
236
-
237
-
238
-
239
-
240
-
241
-
242
-
243
-
244
-
245
-
246
-
247
-
248
-
249
-
250
-
251
-
252
-
253
-
254
-
255
-
256
-
257
-
258
-
259
-
260
-
261
-
262
-
263
-
264
-
265
-
266
-
267
-
268
-
269
-
270
-
271
-
272
-
273
-
274
-
275
-
276
-
277
-
278
-
279
-
280
-
281
-
282
-
283
-
284
-
285
-
286
-
287
-
288
-
289
-
290
-
291
-
292
-
293
-
294
-
295
-
296
-
297
-
298
-
299
-
300
-
301
-
302
-
303
-
304
-
305
-
306
-
307
-
308
-
309
-
310
-
311
-
312
-
313
-
314
-
315
-
316
-
317
-
318
-
319
-
320
-
321
-
322
-
323
-
324
-
325
-
326
-
327
-
328
-
329
-
330
-
331
-
332
-
333
-
334
-
335
-
336
-
337
-
338
-
339
-
340
-
341
-
342
 |
 |

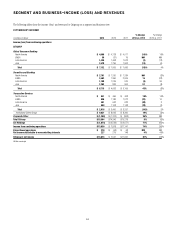
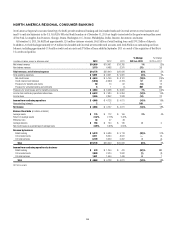
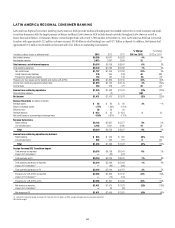
22
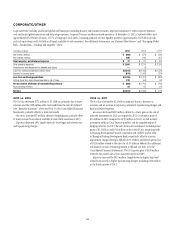
LATIN AMERICA REGIONAL CONSUMER BANKING
Latin America Regional Consumer Banking (Latin America RCB) provides traditional banking and Citi-branded card services to retail customers and small-
to mid-size businesses, with the largest presence in Mexico and Brazil. Latin America RCB includes branch networks throughout Latin America as well as
Banco Nacional de Mexico, or Banamex, Mexico’s second-largest bank, with nearly 1,700 branches. At December 31, 2013, Latin America RCB had 2,021 retail
branches, with approximately 32.2 million customer accounts, $30.6 billion in retail banking loans and $47.7 billion in deposits. In addition, the business had
approximately 9.2 million Citi-branded card accounts with $12.1 billion in outstanding loan balances.
In millions of dollars, except as otherwise noted 2013 2012 2011
% Change
2013 vs. 2012
% Change
2012 vs. 2011
Net interest revenue $6,305 $ 6,061 $ 5,853 4% 4%
Non-interest revenue 3,013 2,697 2,694 12 —
Total revenues, net of interest expense $9,318 $ 8,758 $ 8,547 6% 2%
Total operating expenses $5,244 $ 5,186 $ 5,093 1% 2%
Net credit losses $1,727 $ 1,405 $ 1,333 23% 5%
Credit reserve build (release) 376 254 (153) 48 NM
Provision for benefits and claims 152 167 130 (9) 28
Provisions for loan losses and for benefits and claims (LLR & PBC) $2,255 $ 1,826 $ 1,310 23% 39%
Income from continuing operations before taxes $1,819 $ 1,746 $ 2,144 4% (19)%
Income taxes 384 278 471 38 (41)
Income from continuing operations $1,435 $ 1,468 $ 1,673 (2)% (12)%
Noncontrolling interests 4(2) — NM —
Net income $1,431 $ 1,470 $ 1,673 (3)% (12)%
Balance Sheet data (in billions of dollars)
Average assets $ 82 $ 80 $ 80 3% —%
Return on average assets 1.77% 1.93% 2.21%
Efficiency ratio 56 59 60
Average deposits $ 46.2 $ 45 $ 45.8 3(2)
Net credit losses as a percentage of average loans 4.16% 3.81% 4.12%
Revenue by business
Retail banking $6,135 $ 5,857 $ 5,557 5% 5%
Citi-branded cards 3,183 2,901 2,990 10 (3)
Total $ 9,318 $ 8,758 $ 8,547 6% 2%
Income from continuing operations by business
Retail banking $ 833 $ 909 $ 952 (8)% (5)%
Citi-branded cards 602 559 721 8(22)
Total $ 1,435 $ 1,468 $ 1,673 (2)% (12)%
Foreign Currency (FX) Translation Impact
Total revenue-as reported $9,318 $ 8,758 $ 8,547 6% 2%
Impact of FX translation (1) —(33) (477)
Total revenues-ex-FX $9,318 $ 8,725 $ 8,070 7% 8%
Total operating expenses-as reported $5,244 $ 5,186 $ 5,093 1% 2%
Impact of FX translation (1) —(62) (326)
Total operating expenses-ex-FX $ 5,244 $ 5,124 $ 4,767 2% 7%
Provisions for LLR & PBC-as reported $2,255 $ 1,826 $ 1,310 23% 39%
Impact of FX translation (1) —(19) (104)
Provisions for LLR & PBC-ex-FX $2,255 $ 1,807 $ 1,206 25% 50%
Net income-as reported $1,431 $ 1,470 $ 1,673 (3)% (12)%
Impact of FX translation (1) —25 (82)
Net income-ex-FX $1,431 $ 1,495 $ 1,591 (4)% (6)%
(1) Reflects the impact of foreign exchange (FX) translation into U.S. dollars at 2013 average exchange rates for all periods presented.
NM Not Meaningful