Citibank 2013 Annual Report Download - page 103
Download and view the complete annual report
Please find page 103 of the 2013 Citibank annual report below. You can navigate through the pages in the report by either clicking on the pages listed below, or by using the keyword search tool below to find specific information within the annual report.-
 1
1 -
2
-
3
-
4
-
5
-
6
-
7
-
8
-
9
-
10
-
11
-
12
-
13
-
14
-
15
-
16
-
17
-
18
-
19
-
20
-
21
-
22
-
23
-
24
-
25
-
26
-
27
-
28
-
29
-
30
-
31
-
32
-
33
-
34
-
35
-
36
-
37
-
38
-
39
-
40
-
41
-
42
-
43
-
44
-
45
-
46
-
47
-
48
-
49
-
50
-
51
-
52
-
53
-
54
-
55
-
56
-
57
-
58
-
59
-
60
-
61
-
62
-
63
-
64
-
65
-
66
-
67
-
68
-
69
-
70
-
71
-
72
-
73
-
74
-
75
-
76
-
77
-
78
-
79
-
80
-
81
-
82
-
83
-
84
-
85
-
86
-
87
-
88
-
89
-
90
-
91
-
92
-
 93
93 -
 94
94 -
 95
95 -
 96
96 -
 97
97 -
 98
98 -
 99
99 -
 100
100 -
 101
101 -
 102
102 -
 103
103 -
 104
104 -
 105
105 -
 106
106 -
 107
107 -
 108
108 -
 109
109 -
 110
110 -
 111
111 -
 112
112 -
 113
113 -
114
-
115
-
116
-
117
-
118
-
119
-
120
-
121
-
122
-
123
-
124
-
125
-
126
-
127
-
128
-
129
-
130
-
131
-
132
-
133
-
134
-
135
-
136
-
137
-
138
-
139
-
140
-
141
-
142
-
143
-
144
-
145
-
146
-
147
-
148
-
149
-
150
-
151
-
152
-
153
-
154
-
155
-
156
-
157
-
158
-
159
-
160
-
161
-
162
-
163
-
164
-
165
-
166
-
167
-
168
-
169
-
170
-
171
-
172
-
173
-
174
-
175
-
176
-
177
-
178
-
179
-
180
-
181
-
182
-
183
-
184
-
185
-
186
-
187
-
188
-
189
-
190
-
191
-
192
-
193
-
194
-
195
-
196
-
197
-
198
-
199
-
200
-
201
-
202
-
203
-
204
-
205
-
206
-
207
-
208
-
209
-
210
-
211
-
212
-
213
-
214
-
215
-
216
-
217
-
218
-
219
-
220
-
221
-
222
-
223
-
224
-
225
-
226
-
227
-
228
-
229
-
230
-
231
-
232
-
233
-
234
-
235
-
236
-
237
-
238
-
239
-
240
-
241
-
242
-
243
-
244
-
245
-
246
-
247
-
248
-
249
-
250
-
251
-
252
-
253
-
254
-
255
-
256
-
257
-
258
-
259
-
260
-
261
-
262
-
263
-
264
-
265
-
266
-
267
-
268
-
269
-
270
-
271
-
272
-
273
-
274
-
275
-
276
-
277
-
278
-
279
-
280
-
281
-
282
-
283
-
284
-
285
-
286
-
287
-
288
-
289
-
290
-
291
-
292
-
293
-
294
-
295
-
296
-
297
-
298
-
299
-
300
-
301
-
302
-
303
-
304
-
305
-
306
-
307
-
308
-
309
-
310
-
311
-
312
-
313
-
314
-
315
-
316
-
317
-
318
-
319
-
320
-
321
-
322
-
323
-
324
-
325
-
326
-
327
-
328
-
329
-
330
-
331
-
332
-
333
-
334
-
335
-
336
-
337
-
338
-
339
-
340
-
341
-
342
 |
 |

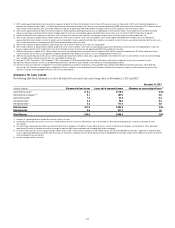
85
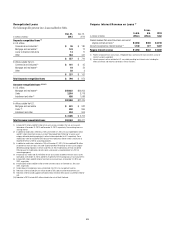
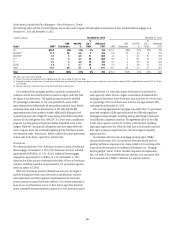
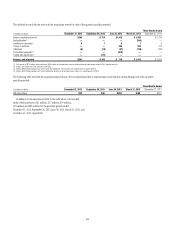
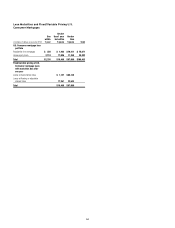
North America Residential First Mortgages—State Delinquency Trends
The following tables set forth, for total Citigroup, the six states and/or regions with the highest concentration of Citi’s residential first mortgages as of
December 31, 2013 and December 31, 2012.
In billions of dollars December 31, 2013 December 31, 2012
State (1) ENR (2)
ENR
Distribution
90+DPD
%
%
LTV >
100%
Refreshed
FICO ENR (2)
ENR
Distribution
90+DPD
%
%
LTV >
100%
Refreshed
FICO
CA $19.2 30% 1.0% 4% 738 $21.1 28% 2.1% 23% 730
NY/NJ/CT (3) 11.7 18 2.6 3 733 11.8 16 4.0 8 723
IN/OH/MI (3) 3.1 5 3.9 21 659 4.0 5 5.5 31 655
FL (3) 3.1 5 4.4 25 688 3.8 5 8.1 43 676
IL (3) 2.7 4 3.8 16 703 3.1 4 5.8 34 694
AZ/NV 1.5 2 2.7 25 710 1.9 3 4.8 50 702
Other 23.1 36 4.1 8 671 29.7 39 5.4 15 667
Total $64.4 100% 2.9% 8% 705 $75.4 100% 4.4% 20% 692
Note: Totals may not sum due to rounding.
(1) Certain of the states are included as part of a region based on Citi’s view of similar HPI within the region.
(2) Ending net receivables. Excludes loans in Canada and Puerto Rico, loans guaranteed by U.S. government agencies, loans recorded at fair value and loans subject to LTSCs. Excludes balances for which FICO or LTV data
are unavailable.
(3) New York, New Jersey, Connecticut, Indiana, Ohio, Florida and Illinois are judicial states.
Citi’s residential first mortgages portfolio is primarily concentrated in
California and the New York/New Jersey/Connecticut region (with New York
the largest of the three states). The significant improvement in refreshed
LTV percentages at December 31, 2013 was primarily the result of HPI
improvements across substantially all metropolitan statistical areas, thereby
increasing values used in the determination of LTV, although the HPI
improvement varies from market to market. Additionally, delinquent and
re-performing asset sales of high LTV loans during 2013 further reduced the
amount of loans with greater than 100% LTV. To a lesser extent, modification
programs involving principal forgiveness further reduced the loans in this
category. While 90+ days past due delinquency rates have improved for the
states or regions above, the continued lengthening of the foreclosure process
(see discussion under “Foreclosures” below) could result in less improvement
in these rates in the future, especially in judicial states.
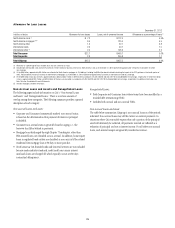
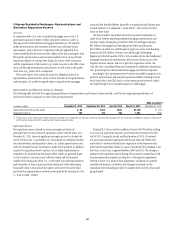
Foreclosures
The substantial majority of Citi’s foreclosure inventory consists of residential
first mortgages. At December 31, 2013, Citi’s foreclosure inventory included
approximately $0.8 billion, or 1.2%, of Citi’s residential first mortgages,
compared to approximately $1.2 billion, or 1.5%, at December 31, 2012
(based on the dollar amount of ending net receivables of loans in foreclosure
inventory, excluding loans that are guaranteed by U.S. government agencies
and loans subject to LTSCs).
While Citi’s foreclosure inventory declined year-over-year, due largely to
portfolio delinquency trends, asset sales and loan modifications, extensive
state requirements and other regulatory requirements for the foreclosure
process continue to impact foreclosure timelines. Citi’s average timeframes to
move a loan out of foreclosure are two to three times longer than historical
norms. Extended foreclosure timelines continue to be even more pronounced
in judicial states (i.e., states that require foreclosures to be processed via
court approval), where Citi has a higher concentration of residential first
mortgages in foreclosure. Active foreclosure units in process for over two years
as a percentage of Citi’s total foreclosure inventory was approximately 29%,
unchanged from December 31, 2012.
Citi’s servicing agreements for mortgage loans sold to the U.S. government
sponsored enterprises (GSEs) generally provide the GSEs with significant
mortgage servicing oversight, including, among other things, foreclosures
or modification completion timelines. The agreements allow for the GSEs
to take action against a servicer for violation of the timelines, including
imposing compensatory fees. While the GSEs have not historically exercised
their rights to impose compensatory fees, they have begun to regularly
impose such fees.
In connection with Citi’s sale of mortgage servicing rights (MSRs)
announced in January 2014, Citi and Fannie Mae substantially resolved
pending and future compensatory fee claims related to Citi’s servicing of the
loans sold in the transaction (for additional information, see “Mortgage
Servicing Rights” below). To date, the GSEs’ imposition of compensatory
fees, as a result of the extended foreclosure timelines or in connection with
the announced sale of MSRs or otherwise, has not been material.