Citibank 2013 Annual Report Download - page 46
Download and view the complete annual report
Please find page 46 of the 2013 Citibank annual report below. You can navigate through the pages in the report by either clicking on the pages listed below, or by using the keyword search tool below to find specific information within the annual report.-
 1
1 -
2
-
3
-
4
-
5
-
6
-
7
-
8
-
9
-
10
-
11
-
12
-
13
-
14
-
15
-
16
-
17
-
18
-
19
-
20
-
21
-
22
-
23
-
24
-
25
-
26
-
27
-
28
-
29
-
30
-
31
-
32
-
33
-
34
-
35
-
 36
36 -
 37
37 -
 38
38 -
 39
39 -
 40
40 -
 41
41 -
 42
42 -
 43
43 -
 44
44 -
 45
45 -
 46
46 -
 47
47 -
 48
48 -
 49
49 -
 50
50 -
 51
51 -
 52
52 -
 53
53 -
 54
54 -
 55
55 -
 56
56 -
57
-
58
-
59
-
60
-
61
-
62
-
63
-
64
-
65
-
66
-
67
-
68
-
69
-
70
-
71
-
72
-
73
-
74
-
75
-
76
-
77
-
78
-
79
-
80
-
81
-
82
-
83
-
84
-
85
-
86
-
87
-
88
-
89
-
90
-
91
-
92
-
93
-
94
-
95
-
96
-
97
-
98
-
99
-
100
-
101
-
102
-
103
-
104
-
105
-
106
-
107
-
108
-
109
-
110
-
111
-
112
-
113
-
114
-
115
-
116
-
117
-
118
-
119
-
120
-
121
-
122
-
123
-
124
-
125
-
126
-
127
-
128
-
129
-
130
-
131
-
132
-
133
-
134
-
135
-
136
-
137
-
138
-
139
-
140
-
141
-
142
-
143
-
144
-
145
-
146
-
147
-
148
-
149
-
150
-
151
-
152
-
153
-
154
-
155
-
156
-
157
-
158
-
159
-
160
-
161
-
162
-
163
-
164
-
165
-
166
-
167
-
168
-
169
-
170
-
171
-
172
-
173
-
174
-
175
-
176
-
177
-
178
-
179
-
180
-
181
-
182
-
183
-
184
-
185
-
186
-
187
-
188
-
189
-
190
-
191
-
192
-
193
-
194
-
195
-
196
-
197
-
198
-
199
-
200
-
201
-
202
-
203
-
204
-
205
-
206
-
207
-
208
-
209
-
210
-
211
-
212
-
213
-
214
-
215
-
216
-
217
-
218
-
219
-
220
-
221
-
222
-
223
-
224
-
225
-
226
-
227
-
228
-
229
-
230
-
231
-
232
-
233
-
234
-
235
-
236
-
237
-
238
-
239
-
240
-
241
-
242
-
243
-
244
-
245
-
246
-
247
-
248
-
249
-
250
-
251
-
252
-
253
-
254
-
255
-
256
-
257
-
258
-
259
-
260
-
261
-
262
-
263
-
264
-
265
-
266
-
267
-
268
-
269
-
270
-
271
-
272
-
273
-
274
-
275
-
276
-
277
-
278
-
279
-
280
-
281
-
282
-
283
-
284
-
285
-
286
-
287
-
288
-
289
-
290
-
291
-
292
-
293
-
294
-
295
-
296
-
297
-
298
-
299
-
300
-
301
-
302
-
303
-
304
-
305
-
306
-
307
-
308
-
309
-
310
-
311
-
312
-
313
-
314
-
315
-
316
-
317
-
318
-
319
-
320
-
321
-
322
-
323
-
324
-
325
-
326
-
327
-
328
-
329
-
330
-
331
-
332
-
333
-
334
-
335
-
336
-
337
-
338
-
339
-
340
-
341
-
342
 |
 |
28
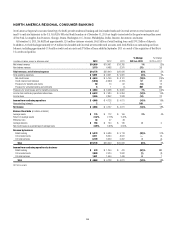
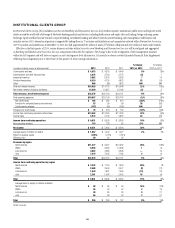
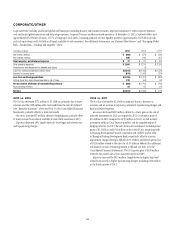
2013 vs. 2012
Net income increased 45%. Excluding negative $345 million of CVA/DVA
(see table below), net income increased 12%, primarily driven by higher
revenues and lower expenses, partially offset by a higher effective tax rate
(see Note 9 to the Consolidated Financial Statements).
Revenues increased 15%. Excluding CVA/DVA:
• Revenues increased 4%, reflecting higher revenues in equity markets,
investment banking and the Private Bank, partially offset by lower
revenues in fixed income markets. Overall, Citi’s wallet share continued
to improve in most major products, while maintaining what Citi believes
to be a disciplined risk appetite for the changing market environment
during 2013.
• Fixed income markets revenues decreased 7%, primarily reflecting
industry-wide weakness in rates and currencies, partially offset by strong
performance in credit-related and securitized products and commodities.
Rates and currencies performance was lower compared to a strong 2012
that benefited from increased client revenues and a more liquid market
environment, particularly in EMEA. 2013 results also reflected a general
slowdown in client activity exacerbated by uncertainty, particularly in the
latter part of 2013, around the tapering of quantitative easing as well as
geopolitical issues. Credit-related and securitized products results reflected
increased client activity driven by improved market conditions and
demand for spread products. In addition, while not generally material to
overall fixed income markets revenues, lower revenues from Citi Capital
Advisors (CCA) during 2013 also contributed to the decline in fixed
income markets revenue year-over-year, as Citi continued to wind down
this business.
• Equity markets revenues increased 22%, primarily due to market
share gains, continued improvement in cash and derivative trading
performance and a more favorable market environment.
• Investment banking revenues increased 8%, reflecting gains in overall
investment banking wallet share. Advisory revenues increased 19%,
reflecting an improvement in wallet share, despite a contraction in the
overall M&A market wallet. Equity underwriting revenues increased
51%, driven by improved wallet share and increased market activity,
particularly initial public offerings. Debt underwriting revenues decreased
6%, primarily due to lower bond underwriting fees and a decline in wallet
share during the year.
• Lending revenues increased 40%, driven by lower mark-to-market losses
on hedges related to accrual loans (see table below) due to less significant
credit spread tightening versus 2012. Excluding the mark-to-market losses
on hedges related to accrual loans, core lending revenues decreased 4%,
primarily due to increased hedge premium costs and moderately lower
loan balances, partially offset by higher spreads. Citi expects demand for
Corporate loans to remain muted in the current market environment.
• Private Bank revenues increased 4%, with growth across all regions and
products, particularly in managed investments, where growth reflected
both higher client assets under management and increased placement
fees, as well as in capital markets. Revenue growth in lending and
deposits, primarily driven by growth in client volumes, was partially offset
by continued spread compression.
Expenses decreased 4%, primarily reflecting repositioning savings, the
impact of lower performance-based compensation, lower repositioning
charges and the impact of FX translation, partially offset by higher legal and
related costs and volume-related expenses.
Provisions decreased $115 million, primarily reflecting higher loan loss
reserve releases, partially offset by an increase in the provision for unfunded
lending commitments in the Corporate loan portfolio.
2012 vs. 2011
Net income decreased 10%. Excluding negative $2.5 billion CVA/DVA
(see table below), net income increased 56%, primarily driven by an increase
in revenues and decrease in expenses.
Revenues decreased 8%. Excluding CVA/DVA:
• Revenues increased 13%, reflecting higher revenues in most major
S&B businesses. Overall, Citi gained wallet share during 2012 in most
major products and regions, while maintaining what it believed to be a
disciplined risk appetite for the market environment.
• Fixed income markets revenues increased 28%, reflecting strong
performance in rates and currencies and higher revenues in credit-related
and securitized products. These results reflected an improved market
environment and more balanced trading flows, particularly in the
second half of 2012. Rates and currencies performance reflected strong
client and trading results in G-10 FX, G-10 rates and Citi’s local markets
franchise. Credit products, securitized markets and municipals products
experienced improved trading results, particularly in the second half of
2012, compared to the prior-year period. Citi’s position serving corporate
clients for markets products also contributed to the strength and diversity
of client flows.
• Equity markets revenues increased 1%, due to improved derivatives
performance as well as the absence of proprietary trading losses in
2011, partially offset by lower cash equity volumes that impacted the
industry as a whole. Citi’s improved performance in derivatives reflected
improved trading and continued progress in capturing additional client
wallet share.
• Investment banking revenues increased 10%, reflecting increases in
debt underwriting and advisory revenues, partially offset by lower equity
underwriting revenues. Debt underwriting revenues rose 18%, driven by
increases in investment grade and high yield bond issuances. Advisory
revenues increased 4%, despite the overall reduction in market activity
during the year. Equity underwriting revenues declined 7%, driven by
lower levels of market and client activity.
• Lending revenues decreased 48%, driven by the mark-to-market losses
on hedges related to accrual loans (see table below). The loss on lending
hedges, compared to a gain in the prior year, resulted from credit spreads
narrowing during 2012. Excluding the mark-to-market losses on hedges